Download
1 / 52
851 likes | 2.17k Vues
Management of Chronic Illness. Prevalence of Chronic Illness. 50% of the population have at least one chronic illness Approximately 30% of adults between 18 and 44 years of age have a chronic illness. Reactions to Chronic Illness. Shock Being stunned, bewildered

E N D
Prevalence of Chronic Illness • 50% of the population have at least one chronic illness • Approximately 30% of adults between 18 and 44 years of age have a chronic illness.
Reactions to Chronic Illness • Shock • Being stunned, bewildered • Behaving in an automatic fashion • Feeling detached (i.e., like observer) • Encounter: disorganized thinking, grief, helplessness, feeling overwhelmed • Retreat: deny and avoid so as to control emotional response to the stressor
Influences on Coping and Chronic Illness • Change plans • Changes view of oneself • Highlights one’s vulnerability • Element of uncertainty (e.g., course, outcome, treatment)
Crisis Theory • Illness-related factors • Greater threat = more difficulty coping • Disfigurement • Embarrassing problems • Visible conditions (e.g., tics, seizures) • Pain • Time commitment for treatment regimen • Lifestyle changes
Behavioural and Personal Factors • Good “copers” have hardy or resilient personalities – can remain positive • Men have more difficulty adjusting to chronic illness • Timing during the lifespan affects reactions • Personal health belief issues
Physical and Social Environmental Factors • Hospital environments can be depressive • Home/hospital environments may not foster self-sufficiency • Social support enhances coping • Network members may act as bad examples
The Tasks and Skills of Coping • Cope with symptoms or disabilities • Adjust to hospital or procedures • Develop and maintain good relationships with practitioners
Psychosocial Functioning Tasks • Control negative feelings and remain positive • Maintain satisfactory self-image • Preserve good relationships • Prepare for uncertain future
Coping Skills • Denying or minimizing • Seeking information • Learning to provide one’s own medical care • Setting concrete, limited goals • Recruiting support • Considering possible future events • Gaining a manageable perspective
Long-term Adaptation • Adaptation – making changes to adjust to life circumstances • Quality of life – fulfillment, purpose, personal control, relationships, activities, personal and intellectual growth, material possessions
Asthma • Impaired breathing due to obstructed airways • More in children than adults • More in boys than girls • Many (up to 50%) no longer have symptoms as adults • 10th most common reason for going to the doctor • Prevalence increasing
Asthma – Physiological Causes and Effects • Immune systems reacts in an allergic manner • Bronchial tubes and other tissues release histamines • Histamines irritate the tissues and they become inflamed, develop spasms, and produce mucus
Asthma - Triggers • Personal factors – illness, feelings of anger and anxiety • Environmental conditions – pollution, pollen, cold • Physical activities – strenuous exercise
Causes • Closely tied to immune system functioning • Genetic component • History of severe respiratory infections
Treatment • Avoid known triggers • Medication: bronchial dilators (treat), anti-inflamatories (prevent) • Exercise
Psychosocial Factors • Strong emotions (e.g., anger, anxiety) affect severity • Mere suggestion of contact with allergen can trigger a reaction
Epilepsy • Recurrent sudden seizures due to electrical disturbances of the cerebral cortex. Two Types are: • Grand mal (or tonic-clonic) – Most severe. There are three phases: • Brief tonic phase – temporary loss of consciousness and stops breathing • Longer clonic phase – muscle spasms, twitching • Relaxed, comatose phase
Epilepsy • Petite mal (or absence) • Diminished consciousness • Stares blankly for a few seconds with possible facial twitching • Person may be unaware of it • Mostly in children • Genetic component • May develop after damage to brain (e.g., injury, infection, stroke)
Epilepsy Treatment • Anticonvulsant drugs – don’t work for all and has undesirable side effects (sometimes long-term cognitive impairment) • Surgery – when cause can be determined and most severe cases – about 30% stop having seizures and 50% have fewer seizures.
Epilepsy – Psychosocial Factors • Stigma • May not be able to drive • Not allowed to perform certain jobs • Emotional arousal may increase the severity of attack • Affected individual and family often adjust poorly in more severe cases
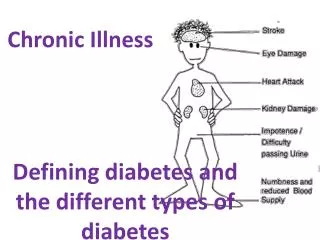
Diabetes Mellitus (sugar in urine) • High levels of blood sugar over time leads to hyperglycemia • Blood glucose is controlled by insulin which is produced by the pancreas • Among the most chronic chronic conditions and many are unaware they have it.
Do you have diabetes?Warning signs • Very frequent urination • Excessive thirst • Often hungry, even after eating • Unexplained large weight loss • Chronically tired • Occasional blurry vision • Wounds heal very slowly • Tingling or numbness in your feet • Waist measurement greater than half your height
Types of Diabetes • Type I – insulin dependent diabetes mellitus (IDDM) • 5-10% of cases have IDDM • Normally develops in childhood • Pancreas not producing insulin so need insulin injections
IDDM - continued • Ketoacidosis – main acute complication. High levels of fatty acid in blood leads to kidney problems and subsequent toxic build-up of wastes in the blood. • Symptoms are: • Chronic thirst, frequent need to urinate, nausea, vomiting, abdominal pain, and difficulty breathing. Can lead to coma and death.
Type II – Non-Insulin Dependent Diabetes Mellitus (NIDDM) • Vast majority of cases • Pancreas produces some insulin • Managed through diet and medication • Usually develops after age 40.
Two Types of NIDDM • Highly overweight – pancreas produces enough insulin but individual is resistant to it. • Normal weight – not enough insulin gets produced. • Genetic component • Viral infection may have damaged the pancreas.
Three Contributing Factors to NIDDM • Diets high in fats and sugars • Stress • Overproduction of a protein that impairs the metabolism of carbohydrates and sugars.
Health Implications of Diabetes Mellitus (I or II) • 1/3 of deaths can be prevented through proper care. • Complications include: • Neuropathy – nerve disease leads to numbness and tingling in extremities, often the feet. High glucose levels destroy myelin sheath that insulates the nerve fibers.
Health Implications of Diabetes Mellitus (I or II) • Blindness • Kidney disease • Gangrene • Heart disease • Peripheral vascular disease • Stroke • Why? High glucose levels leads to thickening of the arterial wall.
Treatment for Diabetes Mellitus • Diet • Medication • Exercise
Diabetic Adherence to Regimen • 80% of patients administer insulin in an unhygienic manner. • 58% administer the wrong dose of insulin. • 77% test or interpret the glucose levels incorrectly. • 75% don’t eat the prescribed foods. • 75% don’t eat with sufficient regularity.
Psychosocial Factors • Social support (adherence ) • Self-efficacy – feel they can handle the regimen and control the disease. • Stress – causes less insulin and more glucose production.
Alzheimer’s Disease • Dementia – progressive loss of cognitive functions. • Alzheimer’s disease is the most common dementia. • Characterized by deterioration of attention, memory, and personality. • Prevalence increases with age. • Gradual deterioration beginning with attention and memory.
Alzheimer’s Disease • Self-care deteriorates • Becomes disorientated • Decline more rapid in presence of other neurological disorders or alcohol abuse history.
Alzheimer’s Disease - Behavioural Disturbances • Paranoid and delusional symptoms • Hallucinatory disturbances • Activity disturbances • Aggressivity • Diurnal rhythm (sleep) disturbance • Affective disturbance • Anxieties and phobias
Alzheimer’s Disease - Psychological and Psychiatric Treatments • Depression • If capable of insight then cognitive behavioural, supportive. • If cognitively impaired then more behavioural strategies (e.g., pleasant activities; reinforcement; maintain familiar/secure surroundings; predictable routine; regular exercise; good diet; problem solving strategies for the care-giver) • Pharmacologic - helpful if know which neurotransmitters (e.g., serotonin, dopamine) is effected but otherwise, trial and error or based on family history of treatment response
Alzheimer’s Disease - Prognosis • Average survival time of about 10.3 years, range a few months to 21 years. • Cognitive decline is patchy, different functions declining at different rates. • Unclear if younger age of onset is associated with a faster decline in cognitive abilities or not. • Education unclear since AD may be detected earlier in less educated individuals. • Aggressive behaviour and wandering and falling predict a faster rate of decline.
Canadian Study of Health and AgingCND Study of Health & Aging. (1994)Can Med Assoc J 150: 899-913 • Subjects - randomly selected community residents > 65 years (including institutions). • Screen for dementia • Positive screened and controls given more extensive cognitive assessment and clinical evaluation. • Excluded life-threatening illness, and other reasons for not being able to do cognitive assessment (e.g., blind).
Canadian Study of Health and AgingCND Study of Health & Aging. (1994)Can Med Assoc J 150: 899-913 • 15,677 sampled • 10,263 screened • 2,923 had clinical assessment.
Canadian Study of Health and Aging: ResultsCND Study of Health & Aging. (1994) • Age-standardized prevalence of AD per 1000 was 80 • Rates indicated that about 8% of Canadians over 65 years of age have dementia • Rates twice as great in women as men • 64% of the dementias were due to AD • AD was more prevalent in Quebec and the Atlantic region
Alzheimer’s Disease - Causes • Lesions of tangled nerve fibers and a protein substance called beta-amyliod. • Genetic component (appears to be linked to certain chromosomes) • Toxic derivatives (aluminum)?? • Traumatic (head injuries) • Infectious (e.g., viral)
Psychosocial Factors • Some studies looking at importance of measuring quality of life in patients directly. • What are the challenges to doing so? • Primary focus of research on caregiver stress
Alxheimer’s Disease (AD) – Effect on Caregivers • Subsample of the Cardiovascular (CVD) Health Study, a prospective study of risk factors for CVD in the elderly. • Excluded: disabled confined to wheel chair, unable to attend field centres, or undergoing cancer treatment. • Caregivers defined as those whose spouse had difficulty with one activity of daily living due to physical or mental health problem. • 392 caregivers and 427 non-caregivers recruited.
AD – Effect on Caregivers • Caregivers were asked to rate the degree of mental and physical strain associated with caregiving (3-point response format). • Sample subdivided into four groups: non-caregivers; spouse disabled but not helping him/her; caregiver but no reports of strain; and caregiver with reports of strain. • Followed for 4.5 years (range 3.4 – 5.5 years). • Main outcome – mortality (100% follow-up achieved).
AD – Effect on CaregiversResults • 81% of caregivers were providing care. • 56% reported caregiver strain. • Mortality – 9.4% in non-caregivers; 17.3% in ‘caregivers’ not providing care; 13.8% in non-strained caregivers; and 17.3% in strained caregivers.
Mortality RatesLeading causes of death • < 1 year • congenital abnormalities; • sudden infant death syndrome (SIDS) • Children > 1 year old • Accidents (40% of all deaths) • Cancer (especially leukemia) • Adolescence • Unintentional injury • Homicide • AIDS
Mortality RatesLeading causes of death • Middle age • Sudden death due to heart attack or stroke • Cancer • Elderly • Heart disease • Cancer • Stroke
Potential Reasons for Gender Differences in Mortality • Females are more hardy • Males engage in riskier behaviours (factor after birth and infancy) • Men engage in riskier sports • Males tend to hold high stress or higher risk jobs • Men tend to have poorer health habits (e.g., drink more alcohol) • Social support may be more protective in women