Download

1 / 29
290 likes | 426 Vues
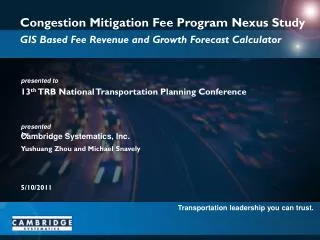
Congestion Mitigation Fee Nexus Feasibility Study. May 2007. What is being explored?. Exploring a congestion mitigation fee that would… Apply to all cities and the county Apply to all new development Address regional transportation impacts

E N D
What is being explored? Exploring a congestion mitigation fee that would… • Apply to all cities and the county • Apply to all new development • Address regional transportation impacts • Cities would select projects consistent with agreed upon guidelines and administer program • Program would meet existing CMP mitigation responsibilities
Why being explored? • Impact of growth on regional transportation system • Impact of growth on communities • Opportunity to grow transportation funding pie and for cities to fund unmet transportation priorities • Existing CMP debit-credit does not bring in new revenue
Demographic Changes Source: SCAG 2004 RTP
We Need Substantial Transportation Investment… 211% 36% 2% 250% 200% 150% Growth Through 2035 100% 50% 0% LaneMiles Vehicle Miles of Travel Total Delay (Vehicle Hours of Delay)
Metro Board Direction • The Metro Board directed Metro staff to conduct a study to explore the feasibility of implementing a Countywide Congestion Mitigation Fee Program on new development • Metro Report will include draft Program Guidelines
Shasta SanJoaquin Yolo Stanislaus Solano Merced ContraCosta* Madera Alameda* Santa Clara* Tulare Kings San LuisObispo Ventura Orange* Riverside* Fees Attempted SanDiego* Fees Adopted Fees Under Study Countywide or Regional Public Facilities Fees Placer ElDorado* Fresno Kern Los Angeles SanBernardino* * Transportation fees only
Congestion Mitigation Fee Program Objectives • Establish a regional mitigation program • Meet regional mitigation requirements under CMP & CEQA • Replace CMP debit/credit program • Ensure continued flow of more than $95 million annually in gas tax revenue to local governments • Ensure local control • Projects selected by each jurisdiction consistent with guidelines • Fee collected separately by each jurisdiction • Fee deposited in separate account with interest credited on fund balances • Generate new revenue for unmet transportation needs • Provide a level playing field countywide
Guiding Principles for Countywide Congestion Mitigation Fee Feasibility Study • Fees should be structured to mitigate congestion from new development without discouraging economic development • Fees are to augment other regional funds, not replace or redirect them • Cities identify local projects with regional benefit consistent with agreed upon guidelines • Cities adopt, collect, and administer congestion mitigation fees • Cities build projects (or cities may choose to participate in multi-jurisdictional or regional projects, if mutually desired)
Guiding Principles for Countywide Congestion Mitigation Fee Feasibility Study (cont.) • Cities with existing fee programs receive dollar-for-dollar credit for local projects with a regional benefit consistent with agreed upon guidelines • Fees should be structured to support transit oriented development, and to exempt mixed use and high density residential development within ¼ mile of rail stations consistent with CMP statute • The program will be developed in a manner to encourage certainty, predictability, and transparency among cities, business, environmental and development communities
Hypothetical Fee Ranges Los Angeles County & All Cities Fee Revenue Annually Los Angeles County & All Cities Fee Revenue 2005-2030 Hypothetical Fee Revenue Ranges Higher End Scenario $16,000 (Santa Clarita) $600 Million $15 Billion Mid-Range Scenario $6,650(Western Riverside COG) $280 Million $7 Billion Lower End Scenario $2,000 (San Diego) $80 Million $2 Billion
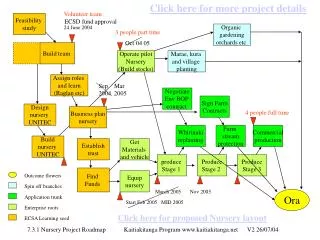
Congestion Mitigation Fee Work Plan • Step 1: Feasibility Study Jan – Fall 2007 - 2 Rounds Outreach with COGs, Cities, Business - Monthly PAC meetings to develop Draft Program Guidelines • Step 2: Project Identification Winter 2007/2008 - Work with Cities to identify projects with regional benefits - Work with Cities to confirm growth forecasts • Step 3: Nexus Study Summer 2008 - Technical work effort to determine nexus • Step 4: Local Implementation Winter 2008/2009 - Work with Cities to adopt Local Ordinance
Outreach to StakeholdersDevelopers, Cities & County, Regional Agencies & COGS • Established Policy Advisory Committee • Continue Meeting with cities and COGs • 7 COGs in October and November • Subregional workshops in January and February • One-on-one meetings with cities on request • Meetings with key private sector interests in January and February
What We Have Heard… • Local Control • What are the fee amounts • Entitlement process • Streamline entitlement process • Increase certainty of mitigation costs • Reliable delivery of specific transportation improvements • Credit for existing fee programs • Addressing the needs of slow growth cities • Flexibility in meeting program requirements • Accommodate economic development concerns • Paying fair share of total improvement costs • Maintaining regional funding commitments by Metro
Program elements and options • Population forecasts • Based on SCAG 2004 Regional Transportation Plan. • Can use local forecasts (i.e., General Plan assumptions) • Eligible projects – regionally significant local projects • Major arterial, highway, and transit capital. • Preliminary regional arterial system (system can be modified in consultation with cities) • Projects should increase mobility on regional system. • Other regional projects may be eligible in consultation with cities.
Status of Feasibility Study:Preliminary Regional Transportation System
Program elements and options (cont.) • Project selection • Projects selected by cities • Fee amount • To be determined in consultation with cities. • Fee calculator available to assist in analyzing fee levels. • Fee structure • Options available for consideration include: • Minimum fee level countywide • Minimum fee by sub-region or groups of cities • Differing fee level by cities • Maximum fee level
Program elements and options (cont.) • Fee calculation method • Fees calculated for all new development • Based on trips generated by land use categories • Proposed use of ITE trip generation rates • Subject to further discussion with PAC, cities and COGs • Exemptions (CMP exemptions) • Low/very low income housing • High density residential or mixed-use within ¼ mile of rail station • Development agreements prior to July 10, 1989 • Reconstruction or replacement of residential or non-residential damaged or destroyed by natural disaster • Any project of a federal, state, or county agency that is exempt for local jurisdiction zoning regulations
Program elements and options (cont.) • Credits for Existing Local Fee Programs • Dollar for dollar credit for regionally significant local fee projects that would qualify under regional program. • Program would become local CMP Deficiency Plan • Implementing fee required to fulfill existing local CMP mitigation responsibilities • Replace current debit-credit approach • Continues flow of Section 2105 State Gas Tax funding
Program elements and options (cont.) • Local Implementation Responsibilities • Select projects • Collect fees and administer program • Report annually to Metro
Advantages for Building Industry • Streamlines entitlements • Potential to leverages regional, state and federal funds • Provides more certainty in entitlement costs • Includes all new development in regional mitigation • Counters no-growth or slow-growth advocacy • Addresses CEQA regional mitigation requirements • All new development pays fair share
Opportunities for Cities • New Source of Revenue for unmet needs - related to new development • Cities determine projects, consistent with guidelines • Cities can plan ahead to link infrastructure needs to growth • Cities can encourage economic development by planning infrastructure needed to attract growth • Cities can work together to pool funds for major projects
12 12 12 12 1 1 11 11 1 1 11 11 2 10 2 2 2 10 10 10 9 3 3 9 3 3 9 9 4 4 8 4 8 4 8 8 5 5 5 7 5 7 7 7 6 6 6 6 12 1 11 2 10 3 9 4 8 5 7 6 Case Study: Arterial Enhancements/Signal Synch. - Multi-city project $6 mil. per lane mile (ROW costs, bikeway, median) $10 mil. per intersection improvement (signal, left turn) $20 mil. per signal interconnect project $50 mil. per grade separation $25k per bus stop (shelter, bench, lighting, map cube)
Case Study:Arterial Capacity Enhancements – Multi-city project Total Cost Project Project Elements Quantity (Millions) Fee* Fee* New lane miles 15 miles $90 $1,163 $1,163 Intersection Imps. 10 intersections $100 $1,293 $2,456 Signal Interconnects 3 projects $60 $776 $3,232 Grade Separation 3 projects $150 $1,929 $5,161 Bus Stops 120 stops $3 $40 $29 Total $403 $5,190 $5,190 * Per Single Family Dwelling Unit (Illustration purposes only)
How a Development Impact Fee Is CalculatedFour Basic Steps Step 1 Step 2 Verify population & employment forecastand convert to land use Convert growth to trip ends 58,200 new residents 25,900 new employees 780,000 new trip-ends 355,500 existing population 170,800 existing employees Adjust trip generation for exempt development
How a Development Impact Fee is Calculated(Continued…) Step 3 Divide project cost by the total number of new trip ends to determine a cost per average daily trip Project Cost $520 per trip end $403 million 780,000 trip-ends
How a Development Impact Fee is Calculated(Continued) Step 4 Generate a fee schedule based on each land use category’s generation of average daily trips Average Daily Trip Generation Fee Land Use Rate Amounts Single Family 9.9 $5,190 Multifamily TBD TBD Office (1,000 sq. ft.) TBD TBD $520 trip end Retail (1,000 sq. ft.) TBD TBD Industrial (1,000 sq. ft.) TBD TBD Hotel/Motel (room) TBD TBD
We Still Have Work To Do…Road Map for Deliberations in 2007 Dates Topic & Issues February 2007 Program Structure • Countywide, sub-regional, or economic zone consistency • Total revenue requirement or adoption of a fee program • Fee calculation method: Land use categories • Exemptions March 2007 Capital Project Funding • Multi-city collaboration • Regional matching funds • Program horizon • Maintenance of Effort April 2007 Implementation • Cost escalation • Credit for demolition of existing buildings • Eligible uses of fee revenues (planning, design, engineering, etc.) • Delivery of capital projects • Reporting and monitoring requirements • Non-compliance Summer 2007 Draft Program Guidelines
Next Steps • Continue outreach to stakeholders • Meetings with cities, COGs, developers and other stakeholders • Monthly PAC meetings – February - May • Continue discussing issues and program elements • Draft Program Guidelines – preliminary recommendations - Summer • Outreach and review of Draft Program Guidelines – Summer • Draft Program Guidelines Presented to Metro Board - Fall • More information: • Robert Calix (213) 922-5644, calixr@metro.net