Download
1 / 6
60 likes | 72 Vues
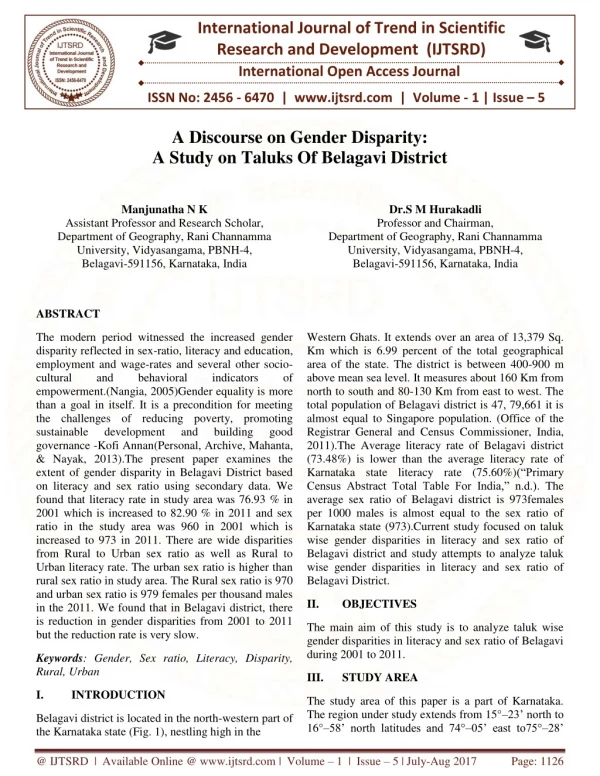
The modern period witnessed the increased gender disparity reflected in sex ratio, literacy and education, employment and wage rates and several other socio cultural and behavioral indicators of empowerment. Nangia, 2005 Gender equality is more than a goal in itself. It is a precondition for meeting the challenges of reducing poverty, promoting sustainable development and building good governance Kofi Annan Personal, Archive, Mahanta, and Nayak, 2013 . The present paper examines the extent of gender disparity in Belagavi District based on literacy and sex ratio using secondary data. We found that literacy rate in study area was 76.93 in 2001 which is increased to 82.90 in 2011 and sex ratio in the study area was 960 in 2001 which is increased to 973 in 2011. There are wide disparities from Rural to Urban sex ratio as well as Rural to Urban literacy rate. The urban sex ratio is higher than rural sex ratio in study area. The Rural sex ratio is 970 and urban sex ratio is 979 females per thousand males in the 2011. We found that in Belagavi district, there is reduction in gender disparities from 2001 to 2011 but the reduction rate is very slow. Manjunatha N K | Dr. S M Hurakadli "A Discourse on Gender Disparity: A Study on Taluks of Belagavi District" Published in International Journal of Trend in Scientific Research and Development (ijtsrd), ISSN: 2456-6470, Volume-1 | Issue-5 , August 2017, URL: https://www.ijtsrd.com/papers/ijtsrd2437.pdf Paper URL: http://www.ijtsrd.com/humanities-and-the-arts/geography/2437/a-discourse-on-gender-disparity-a-study-on-taluks-of-belagavi-district/manjunatha-n-k<br>

E N D
International Journal of Trend in Scientific Research and Development (IJTSRD) International Open Access Journal ISSN No: 2456 - 6470 | www.ijtsrd.com | Volume - 1 | Issue – 5 A Discourse on Gender Disparity: A Study on Taluks Of Belagavi District Manjunatha N K Dr.S M Hurakadli Professor and Chairman, Department of Geography, Rani Channamma University, Vidyasangama, PBNH-4, Belagavi-591156, Karnataka, India Assistant Professor and Research Scholar, Department of Geography, Rani Channamma University, Vidyasangama, PBNH-4, Belagavi-591156, Karnataka, India ABSTRACT Western Ghats. It extends over an area of 13,379 Sq. Km which is 6.99 percent of the total geographical area of the state. The district is between 400-900 m above mean sea level. It measures about 160 Km from north to south and 80-130 Km from east to west. The total population of Belagavi district is 47, 79,661 it is almost equal to Singapore population. (Office of the Registrar General and Census Commissioner, India, 2011).The Average literacy rate of Belagavi district (73.48%) is lower than the average literacy rate of Karnataka state literacy rate (75.60%)(“Primary Census Abstract Total Table For India,” n.d.). The average sex ratio of Belagavi district is 973females per 1000 males is almost equal to the sex ratio of Karnataka state (973).Current study focused on taluk wise gender disparities in literacy and sex ratio of Belagavi district and study attempts to analyze taluk wise gender disparities in literacy and sex ratio of Belagavi District. The modern period witnessed the increased gender disparity reflected in sex-ratio, literacy and education, employment and wage-rates and several other socio- cultural and behavioral empowerment.(Nangia, 2005)Gender equality is more than a goal in itself. It is a precondition for meeting the challenges of reducing poverty, promoting sustainable development governance -Kofi Annan(Personal, Archive, Mahanta, & Nayak, 2013).The present paper examines the extent of gender disparity in Belagavi District based on literacy and sex ratio using secondary data. We found that literacy rate in study area was 76.93 % in 2001 which is increased to 82.90 % in 2011 and sex ratio in the study area was 960 in 2001 which is increased to 973 in 2011. There are wide disparities from Rural to Urban sex ratio as well as Rural to Urban literacy rate. The urban sex ratio is higher than rural sex ratio in study area. The Rural sex ratio is 970 and urban sex ratio is 979 females per thousand males in the 2011. We found that in Belagavi district, there is reduction in gender disparities from 2001 to 2011 but the reduction rate is very slow. indicators of and building good II. OBJECTIVES The main aim of this study is to analyze taluk wise gender disparities in literacy and sex ratio of Belagavi during 2001 to 2011. Keywords: Gender, Sex ratio, Literacy, Disparity, Rural, Urban III. STUDY AREA I. INTRODUCTION The study area of this paper is a part of Karnataka. The region under study extends from 15°–23’ north to 16°–58’ north latitudes and 74°–05’ east to75°–28’ Belagavi district is located in the north-western part of the Karnataka state (Fig. 1), nestling high in the @ IJTSRD | Available Online @ www.ijtsrd.com | Volume – 1 | Issue – 5 | July-Aug 2017 Page: 1126
International Journal of Trend in Scientific Research and Development (IJTSRD) ISSN: 2456-6470 east longitudes . The Belagavi district is divided in to 10 taluks for administrative purposes viz., Athani, Belgaum, Chikodi, Gokak, Hukeri, Khanapur, Parasgad (Saundatii), Ramdurg, Raybag and Sampgaon (Bailhongal). Belgavi district is bordered by Maharashtra state to in the North, Bagalkot district in the East, Dharwad & and Uttar Kannada districts in the South, Goa and Maharashtra state in the west.(Mr. Arun Nivrutti Chandore, n.d.)Belgaum with a total population of 47, 79,661 is the second most populous district in the State and the district ranks first in terms of rural population and third in terms of urban population. The district with a sex ratio of 973 holds 21st rank in the state, the same rank as in 2001 Census. The district has a literacy rate of 73.5 percent and is placed at 16th rank in the state and the male literacy rate in the district is 82.2 percent and the female literacy rate is 64.6 percent. The male – female literacy gap in the district is 17.6 percentage points, which is higher than themale – female literacy gap registered by the state (14.4 percentage points).(Census of India 2011Karnataka, 2011) district, statistical abstracts of Belagavi and Karnataka state and census of India 2001 and 2011. Other various sources of secondary data have been utilized such as internet and books etc. Literacy rate has been computed for the population above 6 years. For the measurement of male female disparity in literacy, the Sopher's Disparity Index (1974) modified by Kundu and Rao (1983) has been employed. Moreover simple mathematical techniques are used to calculate the percentages for sex ratio.The methodology comprises the preparation of Bar graphs for a more effective representation of the data. Literacy rate is computed for the population above six years of age. ???????? ?????????? ????? ?????????? ????? 6 ???×100 1}???????? ???? = 2} David Sopher’s Disparity Index: It is concerned with male and female gap in literacy. David Sopher’s index modified by Prof. Amitabh Kundu,and Rao in 1983(Hajare& Ghurake, 2014). FORMULA LOCATION MAP OF BELAGAVI DISTRICT IN INDIA/KARNATAKA ??? = ????2 ?1+ ???200 − ?1 200 − ?2+ ⋯ Where, X2 is more than X1. X2= is considered Male. X1=is considered Female RESULTS AND DISCUSSION V. BELAGAVI DISTRICT DISPARITY IN LITERACY OF Belgavi district literacy rate in 2011 is 73.48% where as in 2001 it is 61.4%,. The male–female disparity was 0.235 in 2001, while 0.165 in 2011. Table 1show that the literacy rate in the study area varied from a minimum of 66.36% in Ramdurg taluk to a maximum of 83.68% in Belagavi taluk of Belagavi district. In the study area the male literacy is 82.2% and for female it is 64.58% in 2011. It shows a wide gap of 17.62% literacy from male to female. Figure 1. IV. DATABASE AND METHODOLOGY The present research work is based on secondary data obtained from district census handbook of Belagavi @ IJTSRD | Available Online @ www.ijtsrd.com | Volume – 1 | Issue – 5 | July-Aug 2017 Page: 1127
International Journal of Trend in Scientific Research and Development (IJTSRD) ISSN: 2456-6470 Table 1 Disparity of Literacy, 2001-2011 SL No Name of Taluks Literacy-2001 Disparity Of Literacy 0.243 0.247 0.153 0.241 0.283 0.262 0.240 0.246 0.322 0.308 0.235 Literacy-2011 Disparity in M/F Literacy 0.171 0.168 0.108 0.165 0.199 0.181 0.169 0.169 0.223 0.209 0.165 Male 72.54 75.44 86.46 81.56 68.70 74.69 78.06 66.62 69.42 70.47 75.70 Female 49.00 50.99 69.71 56.63 42.84 49.15 53.83 44.14 40.36 42.21 52.30 Male 79.06 81.8 89.63 84.89 77.75 81.21 84.69 75.53 77.53 79.33 82.2 Female 61.47 63.87 77.54 67.00 57.31 62.08 66.39 58.2 54.94 57.69 64.58 1. 2. 3. 4. 5. 6. 7. 8. 9. 10. Athani Bailhongal Belgavi Chikkodi Gokak Hukkeri Khanapur Raibag Ramdurg Savadatti Belagavi district total Data sources: Calculated by using data taken from the 2001 and 2011Population Censuses. Chart 1: Disparity of male and Female Literacy in Belagavi District Disparity of Male and Female Literacy in Belagavi District: 2001-2011 0.35 Disparity of literacy 0.3 0.25 0.2 0.15 0.1 Disparity in M/F Literacy 2001 0.05 0 Name of the Taluks Data sources: calculated by using data taken from the population censuses Table 1 observed that minimum male literacy was in Raibag taluk 75.53% and maximum in Belagavi taluk 89.63% in Belagavi district. There was observed that the minimum female literacy was 54.94% in Ramdurg taluk to a maximum of 77.54% in Belagavi taluk. It shows that there are wide disparities from the male– female literacy rates. (0.209), because of wide gap from male to female literacy. Lower disparity of literacy in male and female observed in Belagavi taluk (0.108), because, Belagavi taluk of Belagavi district experiences high literacy rate of both in male and female. VI. BELAGAVIDISTRICT DISPARITY IN SEX RATIO OF As compared to 2001, disparity of literacy decreased by 0.07 % in 2011, because of increased literacy rate. Highest disparity of male and female is observed in Ramdurg Taluk (0.223) followed by Savadatti taluk Sex ratio is one of the important demographic factors that indicate the status of women in a particular society. A social system with higher sex ratio itself @ IJTSRD | Available Online @ www.ijtsrd.com | Volume – 1 | Issue – 5 | July-Aug 2017 Page: 1128
International Journal of Trend in Scientific Research and Development (IJTSRD) ISSN: 2456-6470 shows the higher status of women (Melorose, Perroy, &Careas, 2015). According to 2001 census the maximum sex ratio is recorded in Khanapur taluk (989), while, minimum sex ratio is recorded in Athani taluk (949). Similarly there are wide disparities from Rural to Urban sex ratio. The rural sex ratio in 2001 it is recorded maximum in Khanapur taluk (995) and minimum in Raibag taluk (946). The urban sex ratio in 2001 it is recorded highest in Ramdurg taluk (981) and minimum in Raibag taluk (923). Table no 2 shows that, in Belagavidistrict the maximum sex ratio arehighest in Hukkeri taluk (991) andlowest in Athani (958) and Raibag taluk (958) respectively. The sex ratio of the districtin 2011 is 973 females per thousand malesare almost equal to the sex ratio of Karnataka state (973). Sex ratios of the taluks are presented in table -2 and it is clear from the table that there is also continuously increase in sex ratio in last two decade. Table 2 Sex Ratios in Rural and Urban Taluks of Belagavi District, 2001 and 2011 SL no 1 2 Taluk Sex Ratio 2001 Total Rural 949 948 969 975 Sex Ratio 2011 Total Rural 958 955 981 977 Urban 967 977 Urban 990 1005 Athani Bailhongal 3 4 Belgavi Chikkodi 946 950 969 946 936 972 967 966 968 959 967 998 5 6 Gokak Hukkeri 972 967 975 970 966 951 990 991 988 991 996 992 7 Khanapur 989 995 959 976 975 983 8 9 Raibag Ramdurg 943 971 946 971 923 981 958 975 957 970 961 1006 10 Savadatti 967 967 968 974 971 1002 Belagavi district total 960 964 950 973 970 979 Source: calculated by using data taken from the Census of India 2001 and provisional Population Tables 2011 Chart 2 Disparity in Rural and Urban sex ratio of Belagavi District 2001-2011 Disparity in Rural and Urban sex ratio of Belagavi District 2001- 2011 1050 Disparity of sex ratio Total sex ratio-2001 1000 950 Rural 900 Urban 850 Total sex ratio 2011 Rural Urban Taluks Source: calculated by using data taken from the Census of India 2001 and provisional Population Tables 2011 @ IJTSRD | Available Online @ www.ijtsrd.com | Volume – 1 | Issue – 5 | July-Aug 2017 Page: 1129
International Journal of Trend in Scientific Research and Development (IJTSRD) ISSN: 2456-6470 According to 2011 census the maximum sex ratio is recorded in Hukkeri taluk (991), while, minimum sex ratio is recorded in Athanitaluk (958). The rural sex ratio in 2011 it is recorded maximum in Hukkerirtaluk (991) and minimum in Athanitaluk (955). The urban sex ratio in 2011 it is recorded highest in Ramdurgtaluk (1006) and minimum in Raibagtaluk (961). The urban sex ratio shows positive change inBailhongal(1005),Ramdurg (1006) and Savadatti(1002).The positive improvement in sex ratio is actually an indication of a decrease in female foeticide in urban taluks. VII. GENDER DISPARITY IN PRIMARY SCHOOL With regard to educational indicators in primary, secondary and tertiary level rural India is lagging behind urban India. The Right to Education Act (RTE) passed in August 2009 has committed the Government of India to the provision of free and compulsory education to all Indian children(Das & Pathak, 2012). Table 3: Net attendance rate- Lower primary School and Higher primary School 2012-13 SL no Name of the taluk Lower primary School Boys % of attendance attendance Higher primary School Boys % of attendance attendance Girls % of Total % of attendanc e 76.25 97.00 97.00 99.45 96.48 96.14 97.00 89.23 98.00 97.00 74.86 Girls % of Total % attendance 1. 2.Bailhongal 3. Belgavi 4. Chikkodi 5. Gokak 6. Hukkeri 7.Khanapur 8. Raibag 9.Ramdurg 10.Savadatti Belagavi district total Data source: calculated by using data taken from the Belgaum district at glance 2012-13 Athani 93.33 97.03 97.68 99.79 96.46 99.00 97.82 89.84 98.10 97.56 77.10 99.17 97.46 98.11 99.12 96.51 99.28 98.54 88.63 98.47 97.62 77.68 93.53 97.33 98.15 99.96 95.63 99.02 97.04 98.74 97.65 97.33 77.94 99.21 97.44 97.74 99.81 74.01 99.67 97.85 100.00 97.82 97.14 76.57 96.38 97.00 96.00 98.88 84.82 99.34 97.00 99.34 97.00 97.00 76.88 Chart 3: Net attendance rate- Lower primary School 2012-13 Net attendance rate of Lower primary School 2012-2013 105 Attendance in % 100 95 90 Boys % of attendance 85 80 Girls % of attendance Source: calculated by using data taken from the Belgaum district at glance 2012-13 @ IJTSRD | Available Online @ www.ijtsrd.com | Volume – 1 | Issue – 5 | July-Aug 2017 Page: 1130
International Journal of Trend in Scientific Research and Development (IJTSRD) ISSN: 2456-6470 Chart 4: Net attendance rate- Higher primary School 2012-13 Net attendance rate- Higher primary School 2012-2013 150 Attendance in % 100 50 Boys % of attendance 0 Girls % of attendance Source: Calculated by using data taken from the Belgaum district at glance 2012-13 Attendance of students mainly in primary schools is very important for acquiring knowledge and learning skills. The attendance has significantly improved after the Mid-Day meal programmes introduced by government of Karnataka(Secretaries & Delhi, n.d.).Table no 3 shows that the primary school net attendance ratios for the 2012 and 2013 school years. Belagavi districts net attendance rate in lower primary schools is 74.86% while Boys attendance ratio is 77.10 % and Girls attendance ratio is 77.68%. Attendance of girls is more than boy’s attendance ratio.The net attendance rate in higher primary schools is 76.88% while Boys attendance ratio is 77.94% and Girls attendance ratio is 76.57%. Attendance of girls is less than boy’s attendance ratio. The girl’s attendance of lower primary school is low in Raibag taluk; interestingly Raibag taluk achieves 100% attendance in higher primary school during 2012 and 2013. Similarly the girl’s attendance of higher primary school is low in Gokak taluk (74.01%) and high in Raibag taluk (100%). Some studies cited the reasons for the low attendance rate are familial commitment, migration, climate induced disasters, famine and poverty led the girl children to abandon schools. during the last decades. This is the indicative of increasing spread of female education in different taluks of Belagavi district. Further studies of disparity in literacy and sex ratio are under progress in our research work. REFERENCE 1)Census of India 2011 Karnataka. (2011). District census handbook Belgaum Directorate Of Census Operations Karnataka. 2)Das, D., & Pathak, M. (2012). The Growing Rural-Urban Disparity in India : Some Issues. International Journalof Advancements in Research and Technology, 1(5), 1–7. 3)Hajare, R. V, & Ghurake, B. B. (2014). R e g i o n a l D i s p a r i t i e s i n L i t e r a c y o f K o l h a p u r D i s t r i c t, (March), 269–278. 4)Melorose, J., Perroy, R., & Careas, S. (2015). No Title No Title. Statewide Agricultural Land Use Baseline 2015, http://doi.org/10.1017/CBO9781107415324.004 5)MR. ARUN NIVRUTTI CHANDORE. (n.d.). Floristic Studies on Monocotyledons of Belgaum District, 2010. 6)Nangia, S. (2005). Women ’ s Empowerment and Gender Equity for XXV IUSSP International Population Conference, (July), 18–23. 7)Office of the Registrar General and Census Commissioner, India. (2011). Census 2011. Retrieved http://www.census2011.co.in/literacy.php 8)Personal, M., Archive, R., Mahanta, B., & Nayak, P. (2013). Mp r a, (43846). 9)Primary Census Abstract Total Table For India. (n.d.). 10)Secretaries, S. E., & Delhi, N. (n.d.). Mid Day Meal Scheme. Assessment. (series-30 ). 1, 1–21. CONCLUSION The spatial variation of literacy in Belagavi district shows a wide gap of 17.62% literacy from male to female. The minimum male literacy is in Raibag taluk 75.53% and maximum in Belagavi taluk 89.63%. There was observed that the minimum female literacy was 54.94% in Ramdurg taluk to a maximum of 77.54% in Belagavi taluk. It shows that there are wide disparities from the male–female literacy rates. It is, however, encouraging to note that sex disparity in literacy in the district has been gradually decreasing from @ IJTSRD | Available Online @ www.ijtsrd.com | Volume – 1 | Issue – 5 | July-Aug 2017 Page: 1131