Download
1 / 7
70 likes | 116 Vues
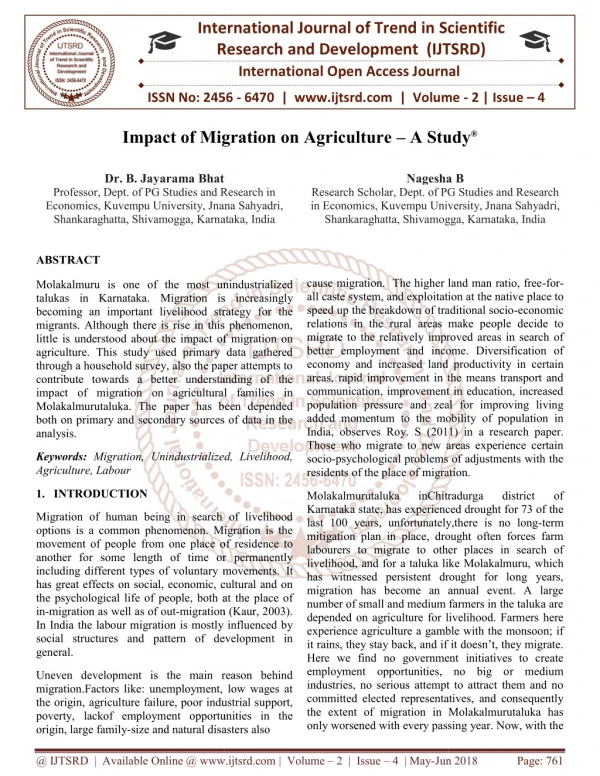
Molakalmuru is one of the most unindustrialized talukas in Karnataka. Migration is increasingly becoming an important livelihood strategy for the migrants. Although there is rise in this phenomenon, little is understood about the impact of migration on agriculture. This study used primary data gathered through a household survey, also the paper attempts to contribute towards a better understanding of the impact of migration on agricultural families in Molakalmurutaluka. The paper has been depended both on primary and secondary sources of data in the analysis. Dr. B. Jayarama Bhat | Nagesha B "Impact of Migration on Agriculture A Studyu00ae" Published in International Journal of Trend in Scientific Research and Development (ijtsrd), ISSN: 2456-6470, Volume-2 | Issue-4 , June 2018, URL: https://www.ijtsrd.com/papers/ijtsrd13042.pdf Paper URL: https://www.ijtsrd.com/economics/development-economics/13042/impact-of-migration-on-agriculture-u2013-a-studyu00ae/dr-b-jayarama-bhat<br>

E N D
International Research Research and Development (IJTSRD) International Open Access Journal Impact of Migration on Agriculture – A Study International Journal of Trend in Scientific Scientific (IJTSRD) International Open Access Journal ISSN No: 2456 ISSN No: 2456 - 6470 | www.ijtsrd.com | Volume 6470 | www.ijtsrd.com | Volume - 2 | Issue – 4 Impact of Migration on Agriculture A Study® Dr. B. Jayarama Bhat Professor, Dept. of PG Studies and Research in Economics, Kuvempu University, Jnana Shankaraghatta, Shivamogga, Karnataka, India Dr. B. Jayarama Bhat Professor, Dept. of PG Studies and Research in Economics, Kuvempu University, Jnana Sahyadri, Nagesha B Nagesha B Dept. of PG Studies and Research Research Scholar, Dept. of PG Studies and Research in Economics, Kuvempu University, Jnana Sahyadri, Shankaraghatta, Shivamogga, Karnataka, India Shankaraghatta, Shivamogga, Karnataka, India in Economics, Kuvempu University, Jnana Sahyadri, Karnataka, India ABSTRACT Molakalmuru is one of the most unindustrialized talukas in Karnataka. Migration is increasingly becoming an important livelihood strategy for the migrants. Although there is rise in this phenomenon, little is understood about the impact of migration on agriculture. This study used primary data gathered through a household survey, also the paper attempts to contribute towards a better understanding of the impact of migration on agricultural families in Molakalmurutaluka. The paper has been depended both on primary and secondary sources of data in the analysis. cause migration. The higher land man ratio, free-for- all caste system, and exploitation at the native place to speed up the breakdown of traditional socio-economic relations in the rural areas make people decide to migrate to the relatively improved areas in search of better employment and income. Diversification of economy and increased land productivity in certain areas, rapid improvement in the means transport and communication, improvement in education, increased population pressure and zeal for improving living added momentum to the mobility of population in India, observes Roy. S (2011) in a research paper. Those who migrate to new areas experience certain psychological problems of adjustments with the cause migration. The higher land man ratio, free all caste system, and exploitation at the nativ speed up the breakdown of traditional socio relations in the rural areas make people decide to migrate to the relatively improved areas in search of better employment and income. Diversification of economy and increased land productivit areas, rapid improvement in the means transport and communication, improvement in education, increased population pressure and zeal for improving living added momentum to the mobility of population in India, observes Roy. S (2011) in a researc Those who migrate to new areas experience certain socio-psychological problems of adjustments with the residents of the place of migration. residents of the place of migration. Molakalmuru is one of the most unindustrialized Migration is increasingly becoming an important livelihood strategy for the migrants. Although there is rise in this phenomenon, little is understood about the impact of migration on iculture. This study used primary data gathered through a household survey, also the paper attempts to contribute towards a better understanding of the impact of migration on agricultural families in Molakalmurutaluka. The paper has been depended rimary and secondary sources of data in the Keywords: Migration, Unindustrialized, Livelihood, Agriculture, Labour Migration, Unindustrialized, Livelihood, 1.INTRODUCTION Molakalmurutaluka Karnataka state, has experienced drought for 73 of the 0 years, unfortunately,there is no long-term mitigation plan in place, drought often forces farm labourers to migrate to other places in search of livelihood, and for a taluka like Molakalmuru, which has witnessed persistent drought for long years, on has become an annual event. A large number of small and medium farmers in the taluka are depended on agriculture for livelihood. Farmers here experience agriculture a gamble with the monsoon; if it rains, they stay back, and if it doesn’t, they migrate. Here we find no government initiatives to create employment opportunities, no big or medium industries, no serious attempt to attract them and no committed elected representatives, and consequently the extent of migration in Molakalmurutaluka has Molakalmurutaluka Karnataka state, has experienced drought for 73 of the last 100 years, unfortunately,there is no long mitigation plan in place, drought often forces farm labourers to migrate to other places in search of livelihood, and for a taluka like Molakalmuru, which has witnessed persistent drought for long years, migration has become an annual event. A large number of small and medium farmers in the taluka are depended on agriculture for livelihood. Farmers here experience agriculture a gamble with the monsoon; if it rains, they stay back, and if it doesn’t, they migrate. Here we find no government initiatives to create employment opportunities, no big or medium industries, no serious attempt to attract them and no committed elected representatives, and consequently the extent of migration in Molakalmurutaluka has only worsened with every passing year. Now, with the sened with every passing year. Now, with the inChitradurga inChitradurga district district of of Migration of human being in search of livelihood options is a common phenomenon. Migration is the movement of people from one place of residence to another for some length of time or permanently including different types of voluntary movements. has great effects on social, economic, cultural and on the psychological life of people, both at the place of in-migration as well as of out-migration (Kaur, 2003). In India the labour migration is mostly influenced by social structures and pattern of development in general. Migration of human being in search of livelihood options is a common phenomenon. Migration is the from one place of residence to another for some length of time or permanently including different types of voluntary movements. It has great effects on social, economic, cultural and on the psychological life of people, both at the place of migration (Kaur, 2003). In India the labour migration is mostly influenced by social structures and pattern of development in Uneven development is the main reason behind migration.Factors like: unemployment, low wages at the origin, agriculture failure, poor industrial support, poverty, lackof employment opportunities in the origin, large family-size and natural disasters also size and natural disasters also Uneven development is the main reason behind migration.Factors like: unemployment, low wages at igin, agriculture failure, poor industrial support, poverty, lackof employment opportunities in the @ IJTSRD | Available Online @ www.ijtsrd.com @ IJTSRD | Available Online @ www.ijtsrd.com | Volume – 2 | Issue – 4 | May-Jun 2018 Jun 2018 Page: 761
International Journal of Trend in Scientific Research and Development (IJTSRD) ISSN: 2456-6470 taluka facing drought for the fourth successive year, the percentage of migration has doubled in the recent years. various agricultural operations, particularly during peak seasons. In a research article on U.S. Agricultural Labour Out-Migration Determinates, X. Zhang and E. Van der Sluis (2006), talked about the actual land values. The nominal land values are from the “Farm Income Data” produced by ERS (USDA, 2009). These values are then deflated using the Producer Price Index (PPI) for Farm Equipment (BLS, 2009). This measure is used rather than the PPI for farm products because like equipment, farm land is an input in the production process. It is more consistent to use the rate of inflation for other inputs, rather than output, to deflate the value of land. The data on direct government payments and net farm income were also gained from the “Farm Income” dataset (USDA, 2009). 2.REVIEW OF LITERATURE A very brief review of studies on the subject has been made here under: An article of A. P. Barkley (1990), entitled The Determinants of the Migration of Labour out of Agriculture in the United States, argues that government payments do not directly slow down the migration of labour from agriculture; rather, their impact on real land values may indirectly influence the outflow of labour. Such a result indicates poorly for the prospects of direct government payments effectively reducing the outflow of young and beginning farmers from agriculture, reducing market risk, and counteracting technological trends. This necessitates a need to build upon the prior research to gain further insight into this important issue and the viability of the current policy options. 3.OBJECTIVES The following two are the objectives of the present paper. To know the reasons for Migration at the talukalevel. A. K. Gupta (1991), in his article entitled Migration of Agricultural Labour from Eastern to North Western Region, found that the influx of labour mainly from the states such as West Bengal, Bihar, Uttar Pradesh, and Rajasthan to Panjab increased manifold. In the beginning, higher wages and almost certain employment were the major economic factors to attract the agriculture labour of migration to Panjab. But later the social factors like network of the co-villagers and caste fellows started attracting the migration. Some other issues that forced them to move to Panjab were incidence of non-availability of jobs, poverty, droughts, floods, and indebtedness at their native place. To study the impact of migration on agriculture in Molakalmurutalukaof Chitradurga district in Karnataka state. 4.THE PAPER The present paper is descriptive and analytical in nature. For the purpose of analysis, both the secondary and primary data were being used. In the taluka of Molakalmuru, in Chitradurga district, a total of 90 respondents, chosen randomly, were personally interviewed by the second author of the paper using structured interview schedule. The information gathered are presented in appropriate Tables and analyzed accordingly.The appropriately interpreted. M.S Sidhu, P.S. Rangi, and K. Singh (1997), in their article on A Study on Migrant Agricultural Labour in Punjab, analyzed that Punjab is one of the agriculturally most developed states in India. Since mid-1960s, with the evolution of high-yielding varieties of crops and the adoption of modern and improved farm practices, agriculture in the state has witnessed an extraordinary growth. With the increase in cropping intensity and farm output along with shift of cropping pattern towards labour-intensive crops like paddy during the late 1970s the state witnessed multiple increase in demand for agricultural labour. As sufficient local labour was not available, farmers of the state had to depend on the in-migrant labour for results are also 5.ANALYSIS AND INTERPRETATION Migration– The Tenure Issue Here using secondary data, published by the Census of India in the year 2011, some issues of migration particularly of the tenure and the reasons of migration are briefly discussed. Table 01 below gives data on tenure specific migration in Karnataka. @ IJTSRD | Available Online @ www.ijtsrd.com | Volume – 2 | Issue – 4 | May-Jun 2018 Page: 762
International Journal of Trend in Scientific Research and Development (IJTSRD) ISSN: 2456-6470 Table-01: Period of Migration (a Tenure of 10 years) Migration (a Tenure of 10 years) (01) Employment Business Rural 5,738,013 (44.26) Urban 3,640,460 (42.44) Total 9,378,477 (43.52) Note: Figures in brackets, horizontally, show percentage to total. Source: Registrar General of India, Census 2011, Data on Migration, Karnataka State (02) (03) Education 3,624,619 (27.97) 1,921,660 (22.36) 5,546,279 (25.73) (04) Marriage 829,735 (06.40) 722,121 (08.41) 1,551,856 (07.22) (05) others 657,566 (05.07) 582,805 (06.78) 1,240,371 (05.75) (06) Total 12,963,327 (100.00) 8,585,854 (100.00) 21,549,181 (100.00) 2,113,394 (16.30) 1,718,804 (20.01) 3,832,198 (17.78) Data presented in Table-01 show that as far as the tenure of migration is concerned, up to 10 years, of the total migrants, as per the 2011 Census, 43.52 per cent migrate for employment, 17.78 per cent for business, 25.73 per cent for education, 07.22 per cent due to marriage, and 05.75 per cent migrate due to the other reasons. It can be inferred from the data that a remarkable proportion of 43.52 percent of the migrants migrate for the purpose of the employment from the rural areas in Karnataka who have migrated up to a tenure of ten years. Further, it would be appropriate here to give data as related to migration over 10 years tenure in Karnataka. The data are presented in Table 02. Table-02 Migration (over 10 years Tenure) Migration (over10 years Tenure) (01) Employment Business Rural 9,228,136 (46.19) Urban 3,868,825 (43.34) Total 14,560,074 (45.47) Note: Figures in brackets, horizontally, show percentage to total. Source: Registrar General of India, Census 2011, Data on Migration, Karnataka State (02) (03) Education Marriage 6,657,027 (33.32) 2,124,760 (23.78) 9,718,786 (30.33) (04) (05) Others 689,897 (03.48) 546,414 (06.11) 1,236,311 (04.13) (06) Total 19,974,917 (100.00) 8,931,724 (100.00) 32,042,212 (100.00) 2,571,109 (12.87) 1,744,065 (19.52) 4,841,288 (15.10) 828,748 (04.14) 647,660 (07.25) 1,595,595 (04.97) Data presented in Table- 02 describe the issue of migration over a 10 years tenure.Of total migrants, as per the 2011 Census, a remarkable proportion of 45.47 percent migrate for the purpose of the employment, 15.10 per cent for business, 30.33 per cent for education, 04.97 per cent due to marriage, and 04.13 per cent migrated for other purposes than the above. Migration-The Reasons Now, the authors take up the issue of reasons of migrationfor analysis. Table-03 below gives data with regard to the reasons of migration; the data are compiled by Census of India. @ IJTSRD | Available Online @ www.ijtsrd.com | Volume – 2 | Issue – 4 | May-Jun 2018 Page: 763
International Journal of Trend in Scientific Research and Development (IJTSRD) ISSN: 2456-6470 Table-03 Reasons for Migration Reasons For Migration (01) Employment Business Rural 4,685,704 (25.32) Urban 3,464,243 (32.99) Total 9,134,767 (28.50) Note: Figures in brackets, horizontally, show percentage to total. Source: Registrar General (02) (03) Education Marriage others 1,658,738 (08.98) (07.28) 1,370,010 (13.05) (10.75) 3,230,348 (10.08) (08.20) (04) (05) (06) Total 18,501,732 (100.00) 10,498,161 (100.00) 32,043,242 (100.00) 10,283,325 (55.58) 4,047,626 (38.55) 15,943,566 (49.80) 1,347,636 526,329 (02.84) 486,911 (04.67) 1,104,178 (03.42) 1,129,371 2,630,383 of India, Census 2011, Data on Migration, Karnataka State Data presented in Table- 03 describe the reasons for migration. It is found that of the total migrants, as per the 2011 Census, a remarkable proportion of 49.80 percent of the migrants migrate for the purpose of the business. About 28.50 per cent migrated for employment, 10.08 per cent for education, 08.20 per cent migrated due to marriage, and 03.42 per cent assigned other reasons for migration. Now in this part of the paper the authors briefly discuss and interpret the primary data gathered through the field survey.In the survey, a total of 90 respondents were personally interviewed by the second author of the paper. Their views and opinions are being analyzed below. The social background of the respondents are important to know, the information pertaining to which are provided in Table 04. Table-04: Social Background of the Respondents Caste Number of Respondents 78 (86.66) 12 (13.34) 00 (00) 90 (100.00) Marital status Number of Respondents 65 (72.23) 23 (25.55) 02 (02.22) 90 (100.00) Occupation Number Respondents 48 (52.33) 17 (18.10) 15 (16.46) 10 (11.11) 90 (100.00) of SC/ST OBC General Total Married Unmarried Widowed Total Labour Non-farm work Factory work Farmer Total Note: Figures in brackets are percentage to the total, vertical. Source: Data gathered through primary investigation, March 2018 From the data presented in the Table 04, it can been observed that of the 90 respondents interviewed, about 86.66 per centbelong to SC/ST categories13.34 per centis OBC and no one hails from General category. It is also found that 72.23 per cent respondents were married,25.55 per cent were unmarried and 02.22 per cent were widowed.Of the total 90 respondents 52.33 per cent is found in farmlabour, 18.10 per cent in Non-farm work, 16.46 per cent is in factory work and a small of 11.11 per cent is farmers. Table 05: Main Activity and reasons for migration of the Respondents Main activity of the Respondents Wage employment 48 (53.35) Farm work Non-farm work Casual Labour Total Number of Respondents Reasons for Migration Number Respondents 48 (53.35) 14 (15.55) 16 (17.77) 12 (13.33) 90 (100.00) of Unemployment Low wages at the origin Agriculture failure Poor industrial support Total 11 (12.22) 16 (17.77) 15 (16.66) 90 (100.00) @ IJTSRD | Available Online @ www.ijtsrd.com | Volume – 2 | Issue – 4 | May-Jun 2018 Page: 764
International Journal of Trend in Scientific Research and Development (IJTSRD) ISSN: 2456-6470 Note: Figures in brackets are percentage to the total, vertical. Source: Data gathered through primary investigation, March 2018 From the study, as shown in the Table-05, it is found that, out of the 90 respondents, 53.35 per cent depended on wage employment, 12.22 per cent on Farm work, and 17.77 per cent on Non-farm work and 16.66 per cent constitute Casual Labour. It is also further found that 53.33 per cent of the respondents assign unemployment as the main reason for Table-06: Current wages and Land size of the Respondents migration. About 15.55 per cent viewed that low wages at the origin is the reason. Agriculture failure and poor industrial support are also the other reasons for migration. Data on the wages earned and land holdings of the respondents under study are presented in Table 06. Current wages of the Respondents (Rs/Day) Number Respondents of Size of land of the Respondents (in hectares) Nil 1-2 3-5 6-8 More than 8 Total Number Respondents of 350-400 400-500 500-600 Total 26 (28.88) 24 (26.66) 40 (44.46) 90 (100.00) 21 (23.33) 23 (25.55) 31 (34.46) 10 (11.11) 05 (05.55) 90 (100.00) Note: Figures in brackets are percentage to the total, vertical. Source: Data gathered through primary investigation, March 2018 The information provided in Table-06 shows that, of the 90 respondents, 28.88 per cent earn Rs.350 to 400 per day,26.66 per cent get a wage of Rs. 400 to 500 per day, about 44.46per cent earn between Rs. 500 and 600 per day, 23.33 per cent is landless,25.55 per cent respondents own1 to 2 hectares of land34.46 per cent own 3 to 5 hectares of land, 11.11 per cent own between 6 and 8 hectares, and 05.55 per cent of the respondents own more than 8 hectares of land. A brief description of the land-type and of the crops grown by the sample respondents is worth providing here. Table 07 provides the data. Table-07: Type of land and Crops grown of the respondents Type of land Number Respondents 14 (15.55) 49 (54.45) 27 (30.00) 90 (100.00) of Crops grown by the Respondents Ragi/Maize Paddy Groundnut Cotton Total Number Respondents 25 (27.77) 13 (14.46) 37 (41.11) 15 (16.66) 90 (100.00) of Irrigated Non-irrigated Nil Total Note: Figures in brackets are percentage to the total, vertical. Source: Data gathered through primary investigation, March 2018 Table 07 presents the details of the responses of thesample respondents interviewed in the field. About 15.55 per cent respondents own irrigated land and a high of 54.45per cent possess Non-irrigated land and 30.00 per cent of themis landless. Further,27.77 per cent of the respondents growRagi/Maize, 14.46 per cent grow paddy, 41.11 per cent grow groundnut and 16.46 per cent cultivate cotton. A question was asked on whetherthe migrants send money to the family and whether the family has been economically improved of migration, the respondents opinion has been presented in Table 08. @ IJTSRD | Available Online @ www.ijtsrd.com | Volume – 2 | Issue – 4 | May-Jun 2018 Page: 765
International Journal of Trend in Scientific Research and Development (IJTSRD) ISSN: 2456-6470 Table 08: Respondent’sOpinion Number of Respondents improvement Opinion Remitting money Yes No Total on Opinion on family Number Respondents of 81 (90) 09 (10) 90 (100.00) Yes No Total 83 (92.23) 07 (07.77) 90 (100.00) Note: Figures in brackets are percentage to the total, vertical. Source: Data gathered through primary investigation, March 2018 According to the survey, about 90 per cent of the respondents found remitting money earned to the family at the origin and 10 per cent do not send any money to the family. Further, a high of92.23 per cent viewed that their family status has economically improved of migration whereas a 07.77 per cent respondent’s family status has not improved economically. The authors were also keen to know about the forces or motivation behind the migration, from the respondents’ perspective, as well the impact of migration at the origin. Their views are presented in Table 09. Table-09: Impact of LabourMigration Forces Migration Agents of Number of Respondents 64 (71.13) Impact Migration Shortage LabourSupply the origin Adverse effect on Production On other activities of Number of Respondents 14 (15.55) Impact Migration Shrink force of Number Respondents 33 (36.67) of of @ inlabour Friends 03 (03.33) 12 (13.33) Delay in sowing / harvesting Total 57 (63.33) Family members own will Total Note: Figures in brackets are percentage to the total, vertical. Source: Data gathered through primary investigation, March 2018 06 (6.66) 64 (71.12) 90 (100.00) 17 (18.88) 90 (100.00) Total 90 (100.00) From the field investigation it has been found that out of the 90 respondents, a high of71.13per cent migrants are motivated by the agents, 03.33 per cent is influenced by friends, 06.66 per cent migrants is forced by family members and 18.88 per cent migrant on their own will. Regarding impacts, it was found that, due to migration, at the origin, labour supply is being disturbed and there by agricultural and other activities are adversely affected, the data prove. Also, as observed by 63.33 per cent of the respondents interviewed, migration has greatly impacted on both sowing and harvesting in the taluka, really a serious matter of concern indeedǃ About 36.67 per cent also viewed that due to migration, at the origin, labour force has shrinked. A matter to be worried much. Labour migration cannot be arrested altogether. However, certain measures to mitigate the problem may be suggested. Table-10: Measures to Reduce Migration Measures viewed by the Respondents Proper implementation MGNERGA Special Prgrammesfor Drought hit areas Reverse Migration Increase wage rate at the origin Promotion of SSIs Total Number Respondents 37 of Percentage 41.11 18 20.00 03 05 03.33 05.55 27 90 30.01 100.00 @ IJTSRD | Available Online @ www.ijtsrd.com | Volume – 2 | Issue – 4 | May-Jun 2018 Page: 766
International Journal of Trend in Scientific Research and Development (IJTSRD) ISSN: 2456-6470 Source: Data gathered through primary investigation, March 2018 About 41.11 per cent of the respondents suggested for effective implementation of MGNERGA in the rural areas. Molakalmuru taluka being a drought hit one, the respondentsplea for (about 20 per cent) evolving special programmes for drought hit areas. The respondents also suggest for (about 30 per cent) promotion of small scale industries in Molakalmuru taluka so that migration can be checked, at least to some extent. The other measures could be of encouraging for reverse migration and as well increasing wage rates at the origin. The figures presented in Table 10 prove the above. REFERENCES 1.Roy S. (2011), Consequences of migration in India: Need and pragmatic solution, Economic Affairs, 56 (1): 41-48. 2.Sidhu M.S. Rangi, P.S. and Singh K. (1997),A Study on Migrant Agricultural Labour in Punjab, Research Bulletin, Department of Economics and Sociology, Punjab Agricultural University, Ludhiana pp: 1-62. 3.Gupta A.K. (1991), Migration of Agricultural Labour from Eastern to North Western region, Social Change, 21 (6): 85-90. CONCLUSION 4.Zhang X. & Van der Sluis E. (2006),U.S. Agricultural Labor Out-Migration Determinates, 1939-2004. Unpublished Thesis. The present study has been an elementary attempt at analysing the impact of migration on agriculture in Molakalmuru taluka, Chitradurga Karnataka. The authors found this a problem of worry. Effective implementation of rural development programmes, particularly of the MGNERGA, would go a long way in mitigating the problem of rural- urban migration. This would help reverse migration as well. Going by the respondents’ views, the authors also suggest for higher allocation of resources to the drought hit areas. Development of the small scale industrial sector would not only promote balanced regional development but as well help mitigate the problem of migration. Also, providing urban amenities in the rural areas would help reduce the problem, so that the rural migrants may stay back, make mind not to migrate. Let us hope for the best at the earliest. District of 5.Barkley A. P. (1990), The Determinants of the Migration of Labor out of Agriculture in the United States, 1940-85. American Journal of Agricultural Economics, 567-573. 6.QuinnMicheal A. (2009), Estimating the Impact of Migration and Remittances on Agricultural Technology, the Journal of Developing Areas 43(1):199-216. 7.Rozelle Scott J. Edward Taylor and Alan Debrauw. (1999), Migration, Remittances and Agricultural Productivity in China, the American Economic Review 89(2):287-291. 8.Registrar General of India, Census report 2011. @ IJTSRD | Available Online @ www.ijtsrd.com | Volume – 2 | Issue – 4 | May-Jun 2018 Page: 767