Market Basket Analysis using Apriori Algorithm in R Language
70 likes | 101 Vues
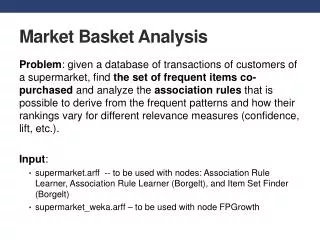
Market Basket Analysis is a data processing technique that is used in the discovery of relations among various items. The main purpose of market basket analysis in retail is to provide information to the distributor to know the buying behaviour of a customer, which can help the distributor in creating the right selections. There are various algorithms available for performing market basket analysis. This paper discusses the data mining technique i.e. association rule mining which may be helpful to examine the customer purchasing behaviour and assists in increasing the sales. Results can provide a valuable reference for cross selling, up selling, devising promotions and placing the merchandise in the store to improve sales. Nidhi Makarand Kawale | Dr. Snehil Dahima "Market Basket Analysis using Apriori Algorithm in R Language" Published in International Journal of Trend in Scientific Research and Development (ijtsrd), ISSN: 2456-6470, Volume-2 | Issue-4 , June 2018, URL: https://www.ijtsrd.com/papers/ijtsrd15677.pdf Paper URL: http://www.ijtsrd.com/computer-science/data-miining/15677/market-basket-analysis-using-apriori-algorithm-in-r-language/nidhi-makarand-kawale<br>

Market Basket Analysis using Apriori Algorithm in R Language
E N D
Presentation Transcript
International Research Research and Development (IJTSRD) International Open Access Journal Market Basket Analysis using Apriori Algorithm in R Language Nidhi Makarand Kawale1, Dr. Snehil Dahima2 1Student, 2Assistant Professor 1,2Master of Computer Application SIES College of Management Studies, Nerul, Navi Mumbai, Maharashtra International Journal of Trend in Scientific Scientific (IJTSRD) International Open Access Journal ISSN No: 2456 ISSN No: 2456 - 6470 | www.ijtsrd.com | Volume 6470 | www.ijtsrd.com | Volume - 2 | Issue – 4 Market Basket Analysis sing Apriori Algorithm Nidhi Mak 1,2 SIES College of Management Studies, Nerul, Maharashtra, India ABSTRACT Market Basket Analysis is a data processing technique that is used in the discovery of relations among various items. The main purpose of market basket analysis in retail is to provide information to the distributor to know the buying behaviour of a customer, which can help the distributor in creating the right selections. There are various algorithms available for performing market basket analysis. This paper discusses the data mining technique i.e. association rule mining which may be helpful to examine the customer purchasing behaviour and assists in increasing the sales. Results can provide a valuable reference for cross-selling, devising promotions and placing the merchandise in the store to improve sales. Keywords: Market Basket Analysis Data Mining; Apriori Algorithm; Association rule mining; R Language. I. INTRODUCTION One of the foremost common and helpful styles of information analysis for selling and marketing is that the market basket analysis. The aim of market basket analysis is to see that which products customers are going to purchase together. 'Market Basket Ana takes its name from the thought of consumers throwing all their purchases into a handcart or ‘a market basket’ throughout grocery looking. Knowing which products customers are going to purchase as a bunch may be terribly useful to a distributor. In some cases, the actual fact that some things sell along appears obvious, for example, each fast burger joints asks their customers "Would you wish burger joints asks their customers "Would you wish fries along with your burger?”. the fact that certain products would sell well to is far from obvious. A well-known example of market basket analysis discovered that diapers and beer sell well together in supermarket on Thursdays [1]. Though the result does make sense stocking up on supplies for themselves and for children before the weekend starts of thing that someone would normally think of right away. The strength of those relationships is valuable information and can be used to cross offer coupons, and make other rec is a decent example of data-driven promoting. If it is known that customers who purchase one product are likely to purchase another product, it is possible for the retailers to market these products together, or to make the purchasers o the target prospects for the second product [2]. If customers who purchase diapers are likely to purchase beer, they will be more likely to if the beer display is just beside the diaper aisle. Likewise, if it is known that customers who purchase a sweater and casual pants from a certain mail-order catalogue have a possibility of purchasing a jacket from the same catalogue, sales of jackets can be increased by having the telephone representatives describing and offering the jacket to anyone who calls in to order the sweater and casual pants. Still better, the catalogue company can provide a discount on the package containing the sweater, casual pants, and jacket and promote the complete package. The amount of sales is proved to increase. By targeting customers who are already known to be potential customers, the effectiveness of marketing significantly increases marketing significantly increases – regardless of the Market Basket Analysis is a data processing technique that is used in the discovery of relations among fries along with your burger?”. However, sometimes the fact that certain products would sell well together pose of market basket known example of market analysis in retail is to provide information to the distributor to know the buying behaviour of a customer, which can help the distributor in creating the right selections. There are various algorithms basket analysis discovered that diapers and beer sell well together in supermarket on Thursdays [1]. gh the result does make sense – young fathers stocking up on supplies for themselves and for their children before the weekend starts – this is not the sort of thing that someone would normally think of right The strength of those relationships is valuable information and can be used to cross-sell, up-sell, offer coupons, and make other recommendations. This basket analysis. This paper discusses the data mining technique i.e. association rule mining which may be helpful to examine the customer purchasing behaviour and assists in increasing the sales. Results can provide a selling, up-selling, driven promoting. devising promotions and placing the merchandise in If it is known that customers who purchase one product are likely to purchase another product, it is possible for the retailers to market these products together, or to make the purchasers of the first product the target prospects for the second product [2]. If customers who purchase diapers are likely to purchase beer, they will be more likely to if the beer display is just beside the diaper aisle. Likewise, if it is known purchase a sweater and casual Market Basket Analysis Data Mining; Apriori Algorithm; Association rule mining; R One of the foremost common and helpful styles of information analysis for selling and marketing is that the market basket analysis. The aim of market basket analysis is to see that which products customers are going to purchase together. 'Market Basket Analysis' takes its name from the thought of consumers throwing all their purchases into a handcart or ‘a market basket’ throughout grocery looking. Knowing which products customers are going to purchase as a bunch may be terribly useful to a distributor. order catalogue have a possibility of purchasing a jacket from the same catalogue, sales of jackets can be increased by having the telephone representatives describing and offering ne who calls in to order the sweater and casual pants. Still better, the catalogue company can provide a discount on the package containing the sweater, casual pants, and jacket and promote the complete package. The amount of sales is proved to y targeting customers who are already known to be potential customers, the effectiveness of n some cases, the actual fact that some things sell along appears obvious, for example, each fast-food @ IJTSRD | Available Online @ www.ijtsrd.com @ IJTSRD | Available Online @ www.ijtsrd.com | Volume – 2 | Issue – 4 | May-Jun 2018 Jun 2018 Page: 2628
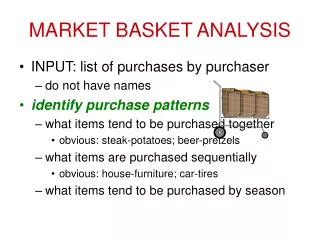
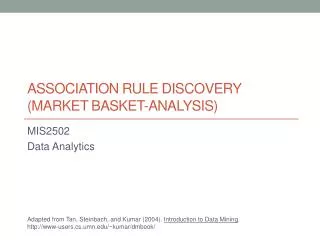
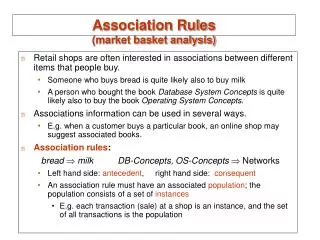
International Journal of Trend in Scientific Research and Development (IJTSRD) ISSN: 2456-6470 marketing takes the form of in-store displays, catalogue layout design, or direct offers to customers [3]. The purpose of market basket analysis is to boost the effectiveness of promoting and sales techniques using customer information already available to the retail company. General Applications of Market Basket Analysis in retail are: 1.Cross-selling, targeting customers to encourage them to spend more on their shopping baskets and drive recommendation engines on the website like customers who bought this also bought this. 2.Product placement or catalogue design, inform the placement of content products on their media sites, or product in their catalogue 3.Store layout, put products that co-occur together close to one another, to improve the customer shopping experience 4.Loss Leader Analysis, a loss leader is a pricing strategy wherever a product is sold-out at a worth below its market price to stimulate different sales of additional profitable merchandise or services. A.Objective of the Study Retailers must understand their current customer's behaviour to be able to predict future customers’ purchasing behaviour. transaction data can help in understanding customers’ purchasing behaviour, offering right bundles and promotions, assortment planning and inventory management to retain customers, improve sales and extend their relationship with customers. 1.To understand the purchasing pattern of products that comprise the customers’ basket. 2.To study the many products usually purchased by the customers. 3.To study the most likely products purchased by the customers along with a particular product category. 4.To predict and suggest products to individual customers. B. Market Basket Analysis Using R R is a great statistical and graphical analysis tool, well suited for advanced analysis. We can apply R to perform the market basket analysis by utilizing the Arules packages. The Arules packages implement the Apriori algorithm, which is one of the most commonly used algorithms associations and correlation between products. II. LITERATURE REVIEW Data mining has taken an important part of marketing literature for the last several decades. Market basket analysis is one amongst the oldest areas within the field of data mining and is the best example for mining association rules. Various algorithms for Association Rule Mining (ARM) have been developed by researchers to help users achieve their objectives. Ramakrishnan Srikant and Rakesh Agrawal [4] proposed apriori algorithm which is one of the classical algorithms for finding frequent patterns for Boolean association rules. The authors elaborate on the concept of mining quantitative rules in large relational tables. Julander [5], analyzed the percentage of customers’ purchasing a certain product and the percentage of all total sales generated by this product. By making such associations, one can easily find out the leading products and what is their share of sales. Measuring which products are the leading products is extremely important since a large number of customers come in contact with these specific product types every day. As the departments with leading products generate much in-store traffic, it is crucial to use this information for placing other specific products nearby. Another significant stream of research in the field of exploratory analysis is the process of generating association rules. Berry and Linoff [6] targeted on discovering getting patterns by extracting associations or co-occurrences from a store’s transactional information. Customers who purchase bread often also purchase several products related to bread like milk, butter or jam. It makes sense that these groups area unit placed side by side in a retail centre so customers can access them quickly. Such related groups of products additionally should be placed side-by-side so as to remind customers of related products and to guide them through the centre in a very logical manner. III.MARKET BASKET ANALYSIS AND THE USED METHODOLOGY A.Market Basket Analysis Market basket analysis explains the combination of merchandise that regularly co-occur in transactions. Let's say, those who purchases bread and eggs, additionally tend to get butter. The promoting team should target customers who purchase bread and eggs with offers on butter, to encourage them to pay a lot Leveraging customer for identifying @ IJTSRD | Available Online @ www.ijtsrd.com | Volume – 2 | Issue – 4 | May-Jun 2018 Page: 2629
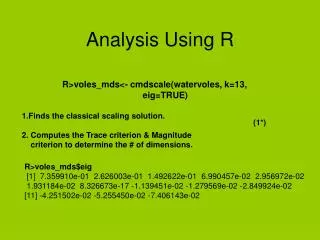
International Journal of Trend in Scientific Research and Development (IJTSRD) ISSN: 2456-6470 of on their basket. It's also called “Affinity Analysis” or “Association Rule Mining”. B.Association Rule Association rule is related to the statement of “what with what”. This matter can be in a form of a statement of transaction activity carried out by the customers at the supermarket. For example, in a retail shop, 100 customers had visited in last month to purchase products. It was observed that out of 100 customers, 50 of them bought Product A, 40 of them bought Product B and 25 of them purchase both Product A and Product B. The significance of an associative rule can be figured in the presence of three parameters, namely support, confidence and lift. Support of a product or set of products is that the fraction of transactions in our information set that contain that product or set of products. ??????? ? =(?ℎ? ?????? ?? ??????????? ?ℎ?? ???????? ?) ( ????? ???????????) In our example, Support of Product A is 50%, Support for Product B is 40% and Support of Product A and B is 25% Confidence is a conditional probability that customer purchase product A will also purchase product B. ??????????(? => ?) = ?(? | ?) =( ?ℎ? ?????? ?? ??????????? ?ℎ?? ???????? ? ??? ? ) (????? ??????????? ?ℎ?? ???????? ?) Out of 50 customers who bought Product A, 25 bought Product B too. It implies if someone purchases product A, they are 50% likely to purchase Product B too. Lift ratio indicates how efficient the rule is in finding consequences, compared to random selection of a transaction. As a general rule, lift ratio greater than one suggests some utility within the rule. A lift greater than one indicates that the presence of A has increased the probability that the product B can occur on this dealing. A lift smaller than one indicates that the presence of A has decreased the probability that the product B can occur on this dealing. ???? (? => ?) = (??????????(? => ?)) C.Apriori Algorithm Apriori algorithm divides the purchasers into completely different segments/groups /clusters at the start. Then it finds the frequent item sets and association rules for those categories individually. Apriori algorithm makes an attempt to search out client behaviours as teams, in order that those specific teams of individuals are often satisfied effectively. The Apriori algorithm works in two steps: 1.Generate all frequent item sets – A frequent item set is an item set that has transaction support above minimum support. 2.Generate all confident association rules from frequent item sets – A confident association rule is a rule with confidence confidence. IV. Experimental Results The data analysis in this paper is based on Instacart website. Instacart helps people cross grocery shopping off their to-do lists with just a few clicks. Customers use the Instacart website and apps to order their favourite products from local stores and we connect them with shoppers who hand pick the items and deliver straight to their door. Instacart, a grocery ordering and delivery app, aims to form it straightforward to fill your refrigerator and pantry along with your personal favourites and staples when you need them. Once choosing product through the Instacart app, personal shoppers review your order and do the in-store searching and delivery for you. The dataset of Instacart [7] used for analysis is of 1 year which consists of 3 million records in total. A. Item Frequency Plot It is important to identify which products were sold how frequently in the dataset. This plot analyses the associations with the help of visualization. Item Frequency Histogram tells what number of times an item has occurred in our dataset as compared to the others. The ratio plot shows that “Banana” and “Bag of Organic Banana” represent most of the dealing dataset. It means that many people are buying these items. So, other items can be placed on the more frequently purchased items to boost the sales. “ggplot2” package is used to load the frequent items histogram. above minimum (???????(?) ) A lift value of 1.25 implies that chance of purchasing product B would increase by 25%. @ IJTSRD | Available Online @ www.ijtsrd.com | Volume – 2 | Issue – 4 | May-Jun 2018 Page: 2630
International Journal of Trend in Scientific Research and Develop International Journal of Trend in Scientific Research and Development (IJTSRD) ISSN: 2456 ment (IJTSRD) ISSN: 2456-6470 Figure 1: Frequent items Histogram Figure 1: Frequent items Histogram B. Rules Based on Support and Confidence Apriori algorithm was used for frequent databases. It proceeds by identifying the frequent individual items in the database and extending them to larger and larger item sets as long as those item se verified by Apriori is used to determine association rules that highlight general trends within the information. Association rules analysis on the Instacart data was done using the “A parameters to be set which are Support and Confidence. A minimum support of 0.007 together with a confidence of 0.25 was set. A minimum support of 0.007 together with a confidence of 0.25 was set. Rules Based on Support and Confidence algorithm was used for frequent item set mining and association rule learning over transactional databases. It proceeds by identifying the frequent individual items in the database and extending them to larger item sets appear sufficiently often in the database. verified by Apriori is used to determine association rules that highlight general trends within the information. verified by Apriori is used to determine association rules that highlight general trends within the information. mining and association rule learning over transactional databases. It proceeds by identifying the frequent individual items in the database and extending them to larger appear sufficiently often in the database. The frequent item sets Association rules analysis on the Instacart data was done using the “A rules” package in R. parameters to be set which are Support and Confidence. les” package in R. It requires 2 Figure 2: Top 5 rules from Instacart data Figure 2: Top 5 rules from Instacart data @ IJTSRD | Available Online @ www.ijtsrd.com Available Online @ www.ijtsrd.com | Volume – 2 | Issue – 4 | May-Jun 2018 Jun 2018 Page: 2631
International Journal of Trend in Scientific Research and Development (IJTSRD) ISSN: 2456-6470 These are the top 5 rules from the Instacart dataset which states that if someone buys Organic Fuji Apple, they are 38% likely to buy Banana too. C.Targeting Items By targeting the items, we can generate rules and limit the output. Figure 3: Which Products Purchased by customers Before Purchasing “Bag of Organic Bananas” A minimum support of 0.005 and confidence of 0.2 was set to find which products purchased by customers before purchasing a bag of organic bananas . Figure 4: Which Products Purchased by customers After Purchasing “Bag of Organic Bananas” A minimum support of 0.005 and confidence of 0.02 was set to find which products were purchased by customers after purchasing a bag of organic bananas. @ IJTSRD | Available Online @ www.ijtsrd.com | Volume – 2 | Issue – 4 | May-Jun 2018 Page: 2632
International Journal of Trend in Scientific Research and Develop International Journal of Trend in Scientific Research and Development (IJTSRD) ISSN: 2456 ment (IJTSRD) ISSN: 2456-6470 analysis of customers' transaction data, to obtain the hidden patterns that prevail in the transactional database. The study analyses the pattern of customers’ purchasing behaviour of products of a retail store. The software proves to be useful for retailers to understand the purchasing behaviour of their customers and gives valuable insights relating to the formation of the basket. It helps in product assortments, make promotions based on products likely to be sold with a particular category, bundling of the products, give discounts to prompt the customers to purchase the products. Retailers can use the analysis for devising strategies and to give suggestions to loyal customers. References 1.Affinity Analysis(2018) http://en.wikipedia.org/wiki/Affinity_analysis http://en.wikipedia.org/wiki/Affinity_analysis. D. Network Graph Visualization In this Visualization, each node represents product in shopping basket and each rule from ==> to of the graph. The graphs tells that if a customer buys Bag of Organic banana, he is likely to shop for Organic Hass Avocado, Organic Strawberries Organic Hass Avocado, Organic Strawberries etc. In this Visualization, each node represents product in analysis of customers' transaction data, to obtain the hidden patterns that prevail in the transactional from ==> to is an edge of the graph. The graphs tells that if a customer buys Bag of Organic banana, he is likely to shop for The study analyses the pattern of customers’ purchasing behaviour of products of a retail store. The proves to be useful for retailers to understand the purchasing behaviour of their customers and gives valuable insights relating to the formation of the basket. It helps in product assortments, make promotions based on products likely to be sold with a ticular category, bundling of the products, give discounts to prompt the customers to purchase the products. Retailers can use the analysis for devising strategies and to give suggestions to loyal customers. Affinity Analysis(2018) Retrieved Retrieved fr from 2.Karthiyayini R. and Balasubramanian R. Affinity Analysis and Association Rule Mining using Apriori Algorithm in Market Basket Analysis, IJARCSSE, Volume 6, Issue 10, pp 241 , Volume 6, Issue 10, pp 241-246. Karthiyayini R. and Balasubramanian R. Affinity Analysis and Association Rule Mining using Apriori Algorithm in Market Basket Analysis, Figure 5: Network graph visualization of “Bag of Organic Banana” Figure 5: Network graph visualization of “Bag of This visualization is done using “arules It is used to understand the association rules, that means to map out the rules in a graph. graph shows us that most of our transactions were consolidated around “Bag of Organic banana V. Conclusion The intense competition between retail stores and increased choices of products available to the customers have created new pressures on marketing decision-makers. There has emerged a need to manage customers in a long-term relationship. The association rules play a major role in data mining applications, trying to find interesting patterns in databases. Apriori is the simplest algorithm which is used for mining of frequent patterns from the customers' transaction database. Frequent pattern mining has been extensively used for market basket 3.Svetina M. and Zupančič. How to increase Sales in Retail with Market Analysis, Systems Integrations (2005), pp 418 of paper with only first word capitalized,” J. Name Stand. Abbrev , in press. Svetina M. and Zupančič. How to increase Sales in Retail with Market Analysis, Systems Integrations (2005), pp 418-428R. Nicole, “Title of paper with only first word capitalized,” J. Name Viz” package. It is used to understand the association rules, that means to map out the rules in a graph. The above graph shows us that most of our transactions were Bag of Organic banana”. 4.Agrawal R. and Srikant R. Fast Algorithm for Mining Association Rules. Proc. of the Int. Conf on Very Large Database, pp. 487 on Very Large Database, pp. 487- 499, 1994 R. and Srikant R. Fast Algorithm for Mining Association Rules. Proc. of the Int. Conf competition between retail stores and increased choices of products available to the customers have created new pressures on marketing makers. There has emerged a need to 5.Julander. Basket Analysis: A New Way of Analyzing Scanner Data. International Journal of Retail and Distribution Management, V (7), pp 10-18 Julander. Basket Analysis: A New Way of Analyzing Scanner Data. International Journal of Retail and Distribution Management, Volume 20 term relationship. The ajor role in data mining 6.Berry and Linoff. Data Mining Techniques for Marketing, Sales and Customer Relationship Management (second edition), Hungry Minds Inc., 2004 Berry and Linoff. Data Mining Techniques for Marketing, Sales and Customer Relationship Management (second edition), Hungry Minds Inc., applications, trying to find interesting patterns in databases. Apriori is the simplest algorithm which is used for mining of frequent patterns from the customers' transaction database. Frequent pattern used for market basket 7.Instacart https://www.instacart.com/dataset 2017. Instacart https://www.instacart.com/datasets/grocery-shopping- Dataset. Dataset. Retrieved Retrieved from from @ IJTSRD | Available Online @ www.ijtsrd.com Available Online @ www.ijtsrd.com | Volume – 2 | Issue – 4 | May-Jun 2018 Jun 2018 Page: 2633