Download
1 / 5
50 likes | 66 Vues
The variable and complicated relation between monetary factors pulled in the scientists, strategy creators and businessmen. Here the paper is endeavor to identify the complex connection between stock returns and oil cost. These factors have seen noteworthy changes after some amount of period and consequently. Here day by day information from April 2007 to November 2016 which is 2,852 information on month to month premise is selected. Utilizing systems of time arrangement the review tries to catch correlation between factors by using VAR and combination strategy. In this review two models are going to tried, one with worldwide unrefined market and second is residential crude market. Dharmendra H. Viroja | Ruhi D. Viroja"Study of Dynamic Linkage between Stock-Market and Crude Oil" Published in International Journal of Trend in Scientific Research and Development (ijtsrd), ISSN: 2456-6470, Volume-1 | Issue-1 , December 2016, URL: http://www.ijtsrd.com/papers/ijtsrd102.pdf http://www.ijtsrd.com/engineering/computer-engineering/102/study-of-dynamic-linkage-between-stock-market-and-crude-oil/dharmendra-h-viroja<br>

E N D
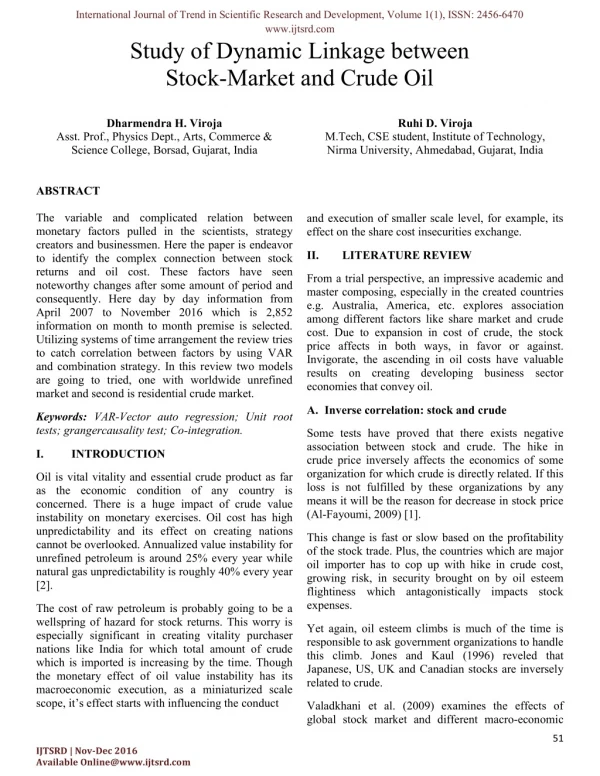
International Journal of Trend in Scientific Research and Development, Volume 1(1), ISSN: 2456-6470 www.ijtsrd.com Study of Dynamic Linkage between Stock-Market and Crude Oil Dharmendra H. Viroja Asst. Prof., Physics Dept., Arts, Commerce & Science College, Borsad, Gujarat, India Ruhi D. Viroja M.Tech, CSE student, Institute of Technology, Nirma University, Ahmedabad, Gujarat, India ABSTRACT The variable and complicated relation between monetary factors pulled in the scientists, strategy creators and businessmen. Here the paper is endeavor to identify the complex connection between stock returns and oil cost. These factors have seen noteworthy changes after some amount of period and consequently. Here day by day information from April 2007 to November 2016 which is 2,852 information on month to month premise is selected. Utilizing systems of time arrangement the review tries to catch correlation between factors by using VAR and combination strategy. In this review two models are going to tried, one with worldwide unrefined market and second is residential crude market. and execution of smaller scale level, for example, its effect on the share cost insecurities exchange. II. LITERATURE REVIEW From a trial perspective, an impressive academic and master composing, especially in the created countries e.g. Australia, America, etc. explores association among different factors like share market and crude cost. Due to expansion in cost of crude, the stock price affects in both ways, in favor or against. Invigorate, the ascending in oil costs have valuable results on creating developing business sector economies that convey oil. A.Inverse correlation: stock and crude Keywords: VAR-Vector auto regression; Unit root tests; grangercausality test; Co-integration. Some tests have proved that there exists negative association between stock and crude. The hike in crude price inversely affects the economics of some organization for which crude is directly related. If this loss is not fulfilled by these organizations by any means it will be the reason for decrease in stock price (Al-Fayoumi, 2009) [1]. I. INTRODUCTION Oil is vital vitality and essential crude product as far as the economic condition of any country is concerned. There is a huge impact of crude value instability on monetary exercises. Oil cost has high unpredictability and its effect on creating nations cannot be overlooked. Annualized value instability for unrefined petroleum is around 25% every year while natural gas unpredictability is roughly 40% every year [2]. This change is fast or slow based on the profitability of the stock trade. Plus, the countries which are major oil importer has to cop up with hike in crude cost, growing risk, in security brought on by oil esteem flightiness which antagonistically impacts stock expenses. The cost of raw petroleum is probably going to be a wellspring of hazard for stock returns. This worry is especially significant in creating vitality purchaser nations like India for which total amount of crude which is imported is increasing by the time. Though the monetary effect of oil value instability has its macroeconomic execution, as a miniaturized scale scope, it’s effect starts with influencing the conduct Yet again, oil esteem climbs is much of the time is responsible to ask government organizations to handle this climb. Jones and Kaul (1996) reveled that Japanese, US, UK and Canadian stocks are inversely related to crude. Valadkhani et al. (2009) examines the effects of global stock market and different macro-economic 51 IJTSRD | Nov-Dec 2016 Available Online@www.ijtsrd.com
International Journal of Trend in Scientific Research and Development (IJTSRD) ISSN: 2456-6470 elements on Thai market utilizing a GARCH-M during 1988- 2004. The inverse/negative relation between stock and other variables is found. Fills (2010) states that there exists contrary influence between crude and Greece market. The same is also supported by Miller and Ratti(2009) and Basher et al. (2012). 1.Data: Informational collection utilized as a part of this review includes the period beginning from April 2007 to November 2016and investigations have been performed by utilizing 2,852information on month to month premise. The websites of BSE,NSE, and Bloomberg DB are using to collect closing information relating to BSE Sensex and SPCNX Nifty Index. B.Positive correlation: stock and crude Due to some economic blast, the overall demand gets high and responsible for hike in basic row products like crude. Increase in crude price is depended on emphatically influence stock market for crude exporter countries [1]. Furthermore, due to high crude price there will be brisk trade of wealth from crude importers to crude exporter’s consequent additional salary. If this wage is used to purchase stock and ventures locally, the resulting effect is period of amore raised measure of money related activity and change of securities trade returns in those countries. Sadorsky (2001) has depicted that there is a positive connection among stock, crude and other variables. He concluded that some organizations of Canada are highly depending on crudeprice fluctuations. Boyer and Filion (2004) have found thatstocks and crude are positively related. For USA, the samerelationship is supported by Hammoudeh and Li (2005).For Indian market, crude and stocks are correlated in longrunwhich is supported by Granger causality test by Sahu etal. (2012). Fig.1: BSE Sensex closing data III. RESEARCH METHODOLOGY The following methodology has been used for the study: Fig.2: Nifty 50 closing data Fig.3: Comparison of Crude oil price with Sensex and Nifty 52 IJTSRD | Nov-Dec 2016 Available Online@www.ijtsrd.com
2.Methodology: A.Johannsen’s co-integration test steps By using different statistics, we first review the information properties from an econometric point of view. After that vector error correction model (VECM) is applied. Furthermore to find long-run relation, variance decomposition test (VDC) and impulse response analysis (IRF) is applied. Granger causality test is used to find short-run relation between variables. It comprises of 3 stages: 1.By using Unit root test make all factors of same order in the system 2.The evaluated residuals should not auto correlated so for that decide ideal lag length. 3.Keeping in mind the end goal to decide the request of cointegration, develop cointegration vectors by using VAR. First analyze the effect of oil cost on securities exchange by Vector Auto-relapse (VAR). Here every one of the factors are thought to be endogenous which means we can represent it by the lagged values of all other endogenous variables of the model and its past values. VAR includes this kind of variables with their past values. B.Stationarity of time series A spurious relapse could nonstationary time series as valuable data or qualities are hard to distinguish. Most financial time arrangements are nonstationary practically speaking. So time series ought to be made stationary subsequent to differencing. Subsequent to differencing, helpful data or attributes can in any case be distinguished in the time series. be prompted by To study the frameworks of correlated time series, vector auto-regression (VAR) is utilized. It is also used to nullify the effect of particular arbitrary variables on system. In VAR, each and every endogenous variable are represented by using its past qualities or lagged values. The Unit root test can be utilized to check where time series is stationary or not. By term stationary means, variance and mean are steady. There is a chance getting spurious relapse for non-stationary series, so some times we cannot get correct result due to this problem. But in case of stationary series we do not have any unit root. pth order VAR model,yt = c + A1yt-1 + A2yt-2 +…+ Apyt-p + εt; (1) Whereyt-1: lth lag of y (at l-periods back), For VAR estimation every one of the factors incorporated into the model ought to be stationary. To check stationarity properties we can use augmented Dickey-Fuller (ADF) as well as Phillips-Perron (PP) [5]. Ai: time-invariant k X k matrix of coefficients to be estimated, εt; k1 vector of error terms A pth-order VAR is known as VAR with p- lags. C.Unit root test For the standard case, all variables are stationary means I (0) so the system is in level and if d > 0 then all variables are non-stationary means I (d). For this we have two cases: As a pre-essential, analyze stationarity of the original time series of factors (mean and fluctuation don’t change with time).Here wrong speculation can be made that unit root is available for particular series so check for existence of unit root and whether a period time series is non-stationary. 1.Variables are co-integrated 2.Variables are not co-integrated Given time series [yt]Tt=1, we can write For the first case, resulting model is Vector error correction model (VECM) for which every error correction term need to be included. For second case, we have to differentiate the variables d-times [4]. yt = Dt + zt + εt; (2) Where, Dt: deterministic component. zt: stochastic component. 53 IJTSRD | Nov-Dec 2016 Available Online@www.ijtsrd.com
International Journal of Trend in Scientific Research and Development (IJTSRD) ISSN: 2456-6470 εt: stationary error terms. E.Johansens co-integration test The main focus of this study is to find whether there existsant unit root in stochastic part or not. Two terms can be co-integrated in econometric view, if there exists long-run connection. The results of Johansens cointegration test give whether the input data (e.g. stock prices and crude prices) are co- integrated or not [3]. Check stationarity of zt with a specific end goal to test the hypothesis of linear co-integration between the oil cost and stock record. The stationarity of zt infers that oil and stock costs are in any event directly co- incorporated and that both markets are reliant and coordinated. We have two sorts of tests either with trace or with maxeigen value yet inductions may be a tad bit diverse. In the event that factors are non-stationary at their levels, significant factors are tried again for unit roots by taking their first contrasts. Trace test: Here null hypothesis is the number of linear combinations (A) is equal to a input value (A0), and the alternative hypothesis for A to be greater than A0 D.Select optimal lag A0: A = A0 (3) If the lag length is very small then maybe it is difficult to find behavior of system factors with the same time if the length is very large then it can be responsible for degraded performance of the system. So select optimal length. A0: A > A0 (4) First A0 is selected as 0 means there is no cointegration, and later we check whether we can reject the null hypothesis or not. If we can reject then we can conclude that there exists minimum one co- integration. We can select lag as large value and by applying VAR frequently at we can select optimal length by decreasing value at each iteration till it becomes zero. Max eigenvalue test: Here null hypothesis is the number of linear combinations (A) is equal to an input value (A0), and the alternative hypothesis for A is There are various techniques for selection like Sequential modified LR test statistics (LR), Final prediction error(FPE), Akaike information criterion (AIC), Schwarz criterion(SC),Hannan-Quinn information criterion (HQ),etc. A0: A = A0 (5) A0: A = A0 + 1 (6) Too short lag length in the VAR may not catch the dynamic conduct of the factors and too long lag length will bend the information and prompt a lessening in power .Traditional approach to choose the lag is by rehashing VAR demonstrate by decreasing lag length from an expansive lag term until it reaches to zero. First A0 is selected as 0 means there is no cointegration, and later we check whether we can reject the null hypothesis or not. If we can reject then we can say that there is only one possible co- integration. The test might be less effective than the follow test for similar qualities. F.Vector error correction model There are different methods for determination like There is a chance of having no relation in terms of short run though if we can find long-run relation between any two factors. The VECM can be helpful to find short-run relation if prior we found any co- integration. So we can use this to find both long and short-run relation by applying some modifications. Final prediction error (FPE), Sequential modified LR test statistics (LR), Schwarz information criteria (SIC), Akaike information criterion (AIC), The results from VECM represent that if there is a fluctuation in any co-related factor affects the whole long run relation. So by using proper error correction Hannan-Quinn information criterion (HQ), etc. 54 IJTSRD | Nov-Dec 2016 Available Online@www.ijtsrd.com
International Journal of Trend in Scientific Research and Development (IJTSRD) ISSN: 2456-6470 techniques this non-balancing factor for particular time is redressed in upcoming time. IV. CONCLUSION By studying the worldwide economic market we can find relation between local or global share market and crude prices. If investor wants to minimize the risk factor for investment in energy related stocks then he must understand the correlation between crude price and local as well as global stock price. G.Granger causality test After applying long-run investigation, we can use Granger causality test. This test is appropriate for examining system variables for having any balance in short time if they are not related with other in long- run. If we want to find that whether the short-run balance exists for set of factors after knowing that there is a long-run relation, then instead of using basic test we are suggested to use error correction methods. In this paper distinctive techniques are depicted to perform long run and additionally short-run investigation between Indian stock exchange and raw crude oil costs. This review is utilized to discover exhaustive comprehension on the dynamic connection between oil cost and stock exchange in India. This review alongside execution is required to offer a few bits of knowledge for money related controllers and policymakers for planning monetary and budgetary strategies. The VECM can identify short-run elements for input data as well as long-run elements for the same. If there is a change in one factor of the system can affect the both type of relations as well as additional factors also. In this model after knowing long-run relations with the help of error correction terms, we can find causality by using t-test and x2-test under combine effect of system variables. REFERENCES 1.Al-Fayoumi, N.A. (2009), Oil prices and stock market returns in oilimporting countries: the case of Turkey, Tunisia and Jordan, EuropeanJournal of Economics, Finance and Administrative Sciences, No. 16, pp.84-98. For two stationary time series a and b, bt = x0 + x1bt-1 + x2bt-2+ … + xpbt-p + errort(7) 2.Chunhong Li, Zhongying Qi, Tan Li, Tang Jie, Xiaona Wang, DynamicRelationship between Oil Price and China Stock market, 978-1-61284-109- 0/11/$26.00 2011 IEEE. bt = x0+x1bt-1+ … +xpbt-p+yqat-q+ … +yrat-r+errort (8) Including lagged values of a, auto regression can be augmented. The shortest lag is q and the longest lag is r, this values are for a. Our null hypothesis is a does not Granger-cause b, which can be proved incorrect iff we found at least one past value of a in regression. 3.Johansen, S. (1991), Estimation and Hypothesis Testing of CointegrationVectors in Gaussian Vector Autoregressive Econometrical,Econometric Society, Vol. 59(6), Page 1551-80. Models, H.Variance decompositions test (VDCs) and Impulse responseanalysis (IRFs) 4.S. Sujit,B. Rajesh Kumar(2011), Study on dynamic relationshipamong gold price, oil price, exchange rate and International Journal of Applied Business and Economic Research, Vol.9, No. 2, (2011): 145- 165. The empirical inferences show that the results of causality test is not enough to depict the correct relation between given parameters. We supposed to use only exogenous variable in VAR system so for this VDC ids used. With the help of VDC we can find how much % of one factor is affected by another. stock market returns, 5.Manish Kumar, The Impact of Oil Price Shocks on Indian Stock and ForeignExchange Markets, ICRA bulletin Money Finance february.2014. The Granger causality test is only helpful to find the proper direction/order of relation but it cannot give accurate result for longer period of time. 6.Sahu, T. N., Bandopadhyay, K., Mondal, D. (2014), An empirical studyon the dynamic relationship between oil prices and Indian stock market, Managerial Finance, 40(2), 200215 The study of IR gives the idea about the movement off actors with respect to change in other for given system. 55 IJTSRD | Nov-Dec 2016 Available Online@www.ijtsrd.com