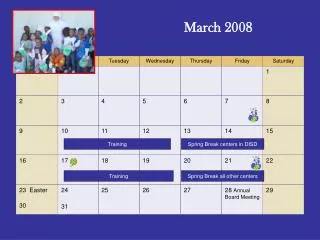
March 2008
Gauteng Wealth Survey. March 2008.

March 2008
E N D
Presentation Transcript
Gauteng Wealth Survey March 2008
Avusa Media, (previously incarnated as Johnnic Media Investments, …, SAAN) has a proven track record among advertising agencies, marketers and media buyers as the media owner that provides credible, regular, up-to-date, solid information on our own and competitive media • Foundation of solid research is the sample design – random probability ensures reliable tracking and generalisability of data • As AVUSA titles target primarily LSM 6 to 10, a research programme was initiated in 2007 which would use a solid and reliable random probability sample, drawn from “affluent” suburbs • What is a “wealthy” individual? What differentiates their consumption of products and media? Where do they shop, what do they wear, how can we communicate with them successfully? Hypothesis that wealthy consumers have a positive mindset resulting in a higher level of engagement with the media, their environment, their acquisition of “things” Background
Media Wealth Surveys were conducted in two key areas of interest to Avusa Media - Gauteng and Eastern Cape • The main marketing objective was to provide media buyers and their clients with current information for media scheduling among adults living in main urban areas • The research objective was to provide the market place with valid and reliable media consumption for cinema, internet, outdoor, print, (including free sheets and community papers in the relevant areas), radio and television together with branded information on selected product categories that are current or potentially major advertisers in AVUSA publications • In addition a Wealth Measure or Index was developed to differentiate respondents in terms of their financial status. • A total sample of 5 000 in Gauteng and 2 000 in Eastern Cape – probability sampling selecting areas of relative financial well being according to personal income (weighted to a population of 2 168 000). Fieldwork – June to August 2007 Background
"In an ever increasingly fragmented media environment, research which offers new and more robust insights is welcomed. It is encouraging that Media Owners are prepared to invest significant money and resources to providing new market insights." “What is important about this survey is that AMPS is used as the benchmark against which the wealth results are measured and the two complement each other. The Wealth Survey also highlights the debate around the issue of how large the affluent black middle class is. However, one has to bear in mind that this is the first time this survey has been produced. Had a survey of this nature been conducted pre-1994, we would be able to track the growth of affluence among blacks more accurately. This survey does not provide historical comparisons; it merely demonstrates the current scenario.“ Gordon Patterson: Chairman of the media industry body AMF and managing director of Starcom “It suggests to me that we are going in the right direction — normally, it takes a generation for people to move from middle class to upper middle class,” Saki Macozoma (The Times 20th February) Some comments about Gauteng Wealth Survey
% Demos of Gauteng Wealth vs National Currency - AMPS
% Demos of Gauteng Wealth vs. National Currency - AMPS
% Top Ten Newspapers Read - % Reach
‘000 Business/Finance Magazines (AIR)
‘000 General Interest Magazines(Average Issue Readership)
‘000 Home/Gardening Magazines (Average Issue Readership)
‘000 Men’s/Sport Magazines (Average Issue Readership)
‘000 Motoring Magazines (Average Issue Readership)
‘000 Women’s Magazines (Average Issue Readership)
‘000 Health/fitness Magazines (Average Issue Readership)
‘000 Travel Magazines (Average Issue Readership)
Bearing in mind that The Times was only launched in June 2007 and the research was completed in the second half of last year the results are very positive. • Those who have ever read = 425 000 • 94% fall into LSM 7-10; 64% into LSM 9-10 • 58% White, 34% Black • 51% Male, 49% Female • 70% aged 35+ • 65% have a tertiary education
One in two come from households with an income in excess of R20 000 • 57% are economically active • 37% have read an average of five out of five issues • Nine in ten read The Times on the issue day only – good for same day response • 94% read the title between 8am and 2pm • Close on 9 in 10 read The Times at home
% TV Channels watched in past 7 days (by percentage)
% Radio Stations listened to in past 7 days (by percentage)
493 000 have accessed internet in past 4 weeks % Rebased on those who have accessed internet in past 4 weeks Internet Usage
814 000 people read Sunday Times, The Times, Sowetan and/or Sunday World % 6% of AVUSA readers have an ADSL line 3% have broadband wireless technology Internet Access from…
Rebased on those who access the internet % AVUSA Readers who access the Internet …
% WM-A – most prosperous group WM-H – least prosperous group Wealth Measure (WM)A-H by those who have accessed the internet in the past four weeks
A composite measure based on a number of wealth variables (using Principle Components Analysis – like LSMs) • Number of cars, type of car, car price, property value, household contents, collectables, cash on hand, business value if sold, expenditure on watch, jewellery, perfume, handbag, sunglasses determinants of cluster into which respondent will classified • Gauteng Wealth Survey respondents divided into 8 approximately equal groups of increasing prosperity – • WMh = least prosperous • WMa – most prosperous Wealth Measure definition
WM-A – most prosperous group WM-H – least prosperous group Wealth Measure (WM)A-H by monthly Household income
WM-A – most prosperous group WM-H – least prosperous group Wealth Measure (WM)A-H by monthly Personal income
WEALTH MEASURE A (Most Prosperous Group)
Average age of 45 36% work for a corporation; 20% have their own business 57% are male Average HH income of R65 063 Average Personal income of R33 558 53% English as home language; 34% Afrikaans; 13% any Black language 70% married 55% have a post-matric qualification 28% are studying towards a further qualification 94% claim not to be emigrating in the next 12 months (pre-Polokwane, pre-blackouts) 18% enjoy visiting game farms Demographics of WM-A consumers
32% engage in some form of exercise (in total) 26% belong to a gym/health club 13% enjoy watching sport at the match venue 10% play golf 8% cycle 5% ride horses 3% do fly-fishing 3% meditate or engage in some form of spiritual relaxation technique 20% go to the movies 16% enjoy attending concerts, opera, ballet, theatre 19% enjoy interior decorating or renovating 17% have an interest in cars or bikes 9% enjoy gambling at a casino Demographics of WM-A consumers
% Wealth Measure WM-A by weeklies
% Wealth Measure WM-A by dailies
% Wealth Measure WM-A by TV Stations
% Wealth Measure WM-A by Radio Stations
% Activities most enjoyed by WM-A sector
% Financial Well-being/Wealth Manifestation
% Personal Well-being
% South African Well-being
Composite of: • Personal Wellbeing • Financial Wellbeing • Personal Achievement • South African Wellbeing Optimism Index
Four levels: • Very Optimistic (513,629 - 24%) • Optimistic (568,912 – 26%) • Neither Optimistic nor Pessimistic (526,349 – 24%) • Pessimistic (559,295 – 26%) Optimism Index
WM H WM G WM F WM E WM D WM C WM B WM A Optimism by wealth
PRODUCT INFORMATION Financial Information
PRODUCT INFORMATION Banking
% Financial Services Make Use Of