Grasshoppers
430 likes | 649 Vues
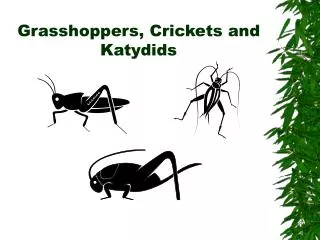
The Classification Problem (informal definition). Katydids. Given a collection of annotated data. In this case 5 instances Katydids of and five of Grasshoppers , decide what type of insect the unlabeled example is. Grasshoppers. Katydid or Grasshopper ?. 10. 9. 8. 7. 6. 5. 4. 3.

Grasshoppers
E N D
Presentation Transcript
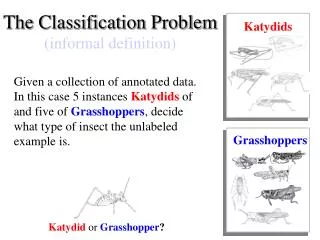
The Classification Problem (informal definition) Katydids Given a collection of annotated data. In this case 5 instances Katydids of and five of Grasshoppers, decide what type of insect the unlabeled example is. Grasshoppers Katydid or Grasshopper?
10 9 8 7 6 5 4 3 2 1 1 2 3 4 5 6 7 8 9 10 Katydids Grasshoppers Simple Linear Classifier R.A. Fisher 1890-1962 Ifpreviously unseen instanceabove the line then class is Katydid else class is Grasshopper
Nearest Neighbor Classifier 10 9 8 7 6 5 4 3 2 1 1 2 3 4 5 6 7 8 9 10 Katydids Grasshoppers Evelyn Fix 1904-1965 Joe Hodges 1922-2000 Antenna Length If the nearest instance to the previously unseen instance is a Katydid class is Katydid else class is Grasshopper Abdomen Length
10 9 8 7 6 5 4 3 2 1 1 2 3 4 5 6 7 8 9 10 Up to now we have assumed that the nearest neighbor algorithm uses the Euclidean Distance, however this need not be the case… Max (p=inf) Manhattan (p=1) Weighted Euclidean Mahalanobis
10 9 8 7 6 5 4 3 2 1 1 2 3 4 5 6 7 8 9 10 Suppose that you have two features {GPA,GRE}, and you think that GRE is twice as important as GPA. You can use the weighted Euclidean distance.. Feature 1 is GPA Feature 2 is GRE Weight vector W = {2, 1} Weighted Euclidean
10 10 10 9 9 9 8 8 8 7 7 7 6 6 6 5 5 5 4 4 4 3 3 3 2 2 2 1 1 1 1 1 1 2 2 2 3 3 3 4 4 4 5 5 5 6 6 6 7 7 7 8 8 8 9 9 9 10 10 10 Hold Out Data • How do we estimate the accuracy of our classifier? • We can use Hold Out data We divide the dataset into 2 partitions, called train and test. We build our models on train, and see how well we do on test. train test
Cross Validation • How do we estimate the accuracy of our classifier? • We can use K-fold cross validation We divide the dataset into K equal sized sections. The algorithm is tested K times, each time leaving out one of the K section from building the classifier, but using it to test the classifier instead Number of correct classifications Number of instances in our database Accuracy = K = 5
Setting parameters and overfitting • You need to classify widgets, you get a training set.. • You could use a Linear Classifier or Nearest Neighbor … • Nearest Neighbor • You could use 1NN, 3NN, 5NN… • You could use Euclidean Distance, LP1, Lpinf, Mahalanobis… • You could do some data editing… • You could do some feature weighting… • You could …. • “Linear Classifier” • You could use a Constant classifier • You could use a Linear Classifier • You could use a Quadratic Classifier • You could…. Model Selection Parameter Selection Or parameter tuning, tweaking
Setting parameters and overfitting • You need to classify widgets, you get a training set.. • You could use a Linear Classifier or Nearest Neighbor … • Nearest Neighbor • You could use 1NN, 3NN, 5NN… • You could use Euclidean Distance, LP1, Lpinf, Mahalanobis… • You could do some data editing… • You could do some feature weighting… • You could …. • “Linear Classifier” • You could use a Constant classifier • You could use a Linear Classifier • You could use a Quadratic Classifier • You could….
Overfitting Overfitting occurs when a statistical model describes random error or noise instead of the underlying relationship. Overfitting generally occurs when a model is excessively complex, such as having too many parameters relative to the number of observations. A model which has been overfit will generally have poor predictive performance, as it can exaggerate minor fluctuations in the data.
Suppose we need to solve a classification problem • We are not sure if we should us the.. • Simple linear classifier • or the • Simple quadratic classifier • How do we decide which to use? We do cross validation or leave-one out and choose the best one.
100 100 90 90 80 80 70 70 60 60 50 50 40 40 30 30 20 20 10 10 10 10 20 20 30 30 40 40 50 50 60 60 70 70 80 80 100 100 90 90 • Simple linear classifier gets 81% accuracy • Simple quadratic classifier 99% accuracy
Simple linear classifier gets 96% accuracy • Simple quadratic classifier 97% accuracy
This problem is greatly exacerbated by having too little data • Simple linear classifier gets 90% accuracy • Simple quadratic classifier 95% accuracy
What happens as we have more and more training examples? The accuracy for all models goes up! The chance of making a mistake (choosing the wrong model) goes down Even if we make a mistake, it will not matter too much (because we would learn a degenerate quadratic it is basically a straight line) • Simple linear 70% accuracy • Simple quadratic 90% accuracy • Simple linear 90% accuracy • Simple quadratic 95% accuracy • Simple linear 99.999999% accuracy • Simple quadratic 99.999999% accuracy
One Solution: Charge Penalty for complex models • For example, for the simple {polynomial} classifier, we could “charge” 1% for every increase in the degree of the polynomial • Simple linear classifier gets 90.5% accuracy, minus 0, equals 90.5% • Simple quadratic classifier 97.0% accuracy, minus 1, equals 96.0% • Simple cubic classifier 97.05% accuracy, minus 2, equals 95.05% Accuracy = 90.5% Accuracy = 97.0% Accuracy = 97.05% 10 10 10 9 9 9 8 8 8 7 7 7 6 6 6 5 5 5 4 4 4 3 3 3 2 2 2 1 1 1 1 2 3 4 5 6 7 8 9 1 2 3 4 5 6 7 8 9 1 2 3 4 5 6 7 8 9 10 10 10
One Solution: Charge Penalty for complex models • For example, for the simple {polynomial} classifier, we could charge 1% for every increase in the degree of the polynomial. • There are more principled ways to charge penalties • In particular, there is a technique called Minimum Description Length (MDL)
Suppose you have a four feature problem, and you want to search over feature subsets. It happens to be the case that features 2 and 3, shown here Are all you need, and the other features are random
1 2 3 4 1,2 1,3 2,3 1,4 2,4 3,4 1,2,3 1,2,4 1,3,4 2,3,4 1,2,3,4 Suppose you have a four feature problem, and you want to search over feature subsets. It happens to be the case that features 2 and 3, shown here are all you need, and the other features are random 0 1 2 3 4
Mantled Howler Monkey Alouatta palliata Lowland Gorilla Gorilla gorilla graueri DTW Alignment Euclidean Distance Which is better, Euclidean Distance or DTW? Mountain Gorilla Gorilla gorilla beringei Red Howler Monkey Alouatta seniculus seniculus
15.61 33.71
In this region Euclidean is better DTW Error In this region DTW is better Euclidean Error
A paper claims… *ERP performs the best (over) DTW… Datasets are small Only three datasets (one is synthetic) So let us do better tests… Lei Chen, Raymond T. Ng: On The Marriage of Lp-norms and Edit Distance. VLDB 2004: 792-803
*ERP performs the best (over) DTW … In this region ERP is better
Suppose the claim was “ERP performs the best (over) DTW, when the data is periodic (or X)” That is fine, but you state what the X is, ahead of time. In this region ERP is better
Our approach, TQuEST, significantly outperforms the only competitor (DTW)… Johannes Aßfalg, Thomas Bernecker, Hans-Peter Kriegel, Peer Kröger, Matthias Renz: Periodic Pattern Analysis in Time Series Databases. DASFAA 2009: 354-368 Johannes Aßfalg, Hans-Peter Kriegel, Peer Kröger, Peter Kunath, Alexey Pryakhin, Matthias Renz: T-Time: Threshold-Based Data Mining on Time Series. ICDE 2008: 1620-1623 Johannes Aßfalg, Hans-Peter Kriegel, Peer Kröger, Peter Kunath, Alexey Pryakhin, Matthias Renz: Similarity Search in Multimedia Time Series Data Using Amplitude-Level Features. MMM 2008: 123-133 Johannes Aßfalg, Hans-Peter Kriegel, Peer Kröger, Peter Kunath, Alexey Pryakhin, Matthias Renz: Interval-Focused Similarity Search in Time Series Databases. DASFAA 2007: 586-597 Johannes Aßfalg, Hans-Peter Kriegel, Peer Kröger, Peter Kunath, Alexey Pryakhin, Matthias Renz: Semi-Supervised Threshold Queries on Pharmacogenomics Time Sequences. APBC 2006: 307-316 Johannes Aßfalg, Hans-Peter Kriegel, Peer Kröger, Peter Kunath, Alexey Pryakhin, Matthias Renz: TQuEST: Threshold Query Execution for Large Sets of Time Series. EDBT 2006: 1147-1150 Johannes Aßfalg, Hans-Peter Kriegel, Peer Kröger, Peter Kunath, Alexey Pryakhin, Matthias Renz: Similarity Search on Time Series Based on Threshold Queries. EDBT 2006: 276-294 Johannes Aßfalg, Hans-Peter Kriegel, Peer Kröger, Peter Kunath, Alexey Pryakhin, Matthias Renz: Threshold Similarity Queries in Large Time Series Databases. ICDE 2006: 149 Johannes Aßfalg, Hans-Peter Kriegel, Peer Kröger, Peter Kunath, Alexey Pryakhin, Matthias Renz: Time Series Analysis Using the Concept of Adaptable Threshold Similarity. SSDBM 2006: 251-260
Our approach, TQuEST, significantly outperforms the only competitor (DTW)… In this region TQuEST is better
How come there are so many claims in the literature, that are simply not true?
c q c= [ 1.2, 1.3, 1.5, …, 2.9] q= [ 1.0, 1.2, 1.2, …, 3.1] Euclidean Distance
c q c= [ 1.2, 1.3, 1.5, …, 2.9] q= [ 1.0, 1.2, 1.2, …, 3.1] w= [ 2, 2, 2, …,1,1,1,…, 2, 2, 2] Euclidean Distance Weighted Euclidean Distance
How do we set the weights? For every dataset We come up with a set of weights (somehow) We test them with leaving one out, and report the best results
I have done this.... Weighted Euclidean DOES work a lot better
How does ANA work? • We downloaded the mitochondrial DNA of a monkey, Macacamulatta. We converted the DNA to a string of integers, with • A (Adenine) = 0 • C (Cytosine) = 1 • G (Guanine) = 2 • T (Thymine) = 3 • So the DNA string GATCA. . . becomes 2, 0, 3, 1, 0, . . .. • Given that we have a string of 16564 integers, we can use • the integers starting a K as weighs when calculating the weights • of the Euclidean distance. • If K = 1 is not good, we try K = 2, then K = 3…. • So ANA is nothing more than the weighed Euclidean • distance, weighed by monkey DNA.
Researchers are adjusting the parameters after seeing the results on the test set.
Hold Out Data • How do we estimate the accuracy of our classifier? • We can use Hold Out data We divide the dataset into 2 partitions, called train and test. We build our models on train, and see how well we do on test. train test
You can do what you want on the training data, try different weights/parameters settings/algorithms/feature subsets etc train When you are done, you test once on the testing set, STOP, and report the results in your paper. If you go back to the training data and make a change, your results will be optimistic. test
Take home lessons Don’t believe papers you read Avoid fooling yourself Convince the reviewers that you are not fooling yourself