Chapter 3 Data and Signals
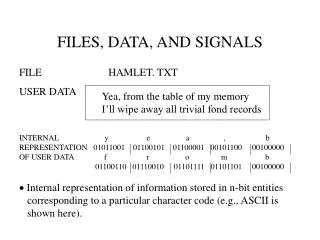
Chapter 3 Data and Signals. ANALOG AND DIGITAL. Data can be analog or digital. The term analog data refers to information that is continuous ; Digital data refers to information that has discrete states. Comparison of analog and digital signals. Note.


Chapter 3 Data and Signals
E N D
Presentation Transcript
ANALOG AND DIGITAL Data can be analog or digital. The term analog data refers to information that is continuous; Digital data refers to information that has discrete states.
Note • In data communications, we commonly use periodic analog signals and nonperiodic (aperiodic) digital signals.
PERIODIC ANALOG SIGNALS Periodic analog signals can be classified as simple or composite. A simple periodic analog signal, a sine wave, cannot be decomposed into simpler signals. A composite periodic analog signal is composed of multiple sine waves.
Example 3.1 • The power in your house can be represented by a sine wave with a peak amplitude of 155 to 170 V. However, it is common knowledge that the voltage of the power in U.S. homes is 110 to 120 V. This discrepancy is due to the fact that these are root mean square (rms) values. The signal is squared and then the average amplitude is calculated. The peak value is equal to 2½ × rmsvalue.
Two Signal • with the same phase and frequency, • but different amplitudes
Example 3.2 • The voltage of a battery is a constant; this constant value can be considered a sine wave, as we will see later. For example, the peak value of an AA battery is normally 1.5 V.
Frequency and Period • Frequency and period are the inverse of each other.
Two Signals • with the same amplitude and phase, • but different frequencies
Example 3.3 • The power we use at home has a frequency of 60 Hz. The period of this sine wave can be determined as follows:
Example 3.4 • Express a period of 100 ms in microseconds. • Solution • From Table 3.1 we find the equivalents of 1 ms (1 ms is 10−3 s) and 1 s (1 s is 106 μs). We make the following substitutions:.
Example 3.5 • The period of a signal is 100 ms. What is its frequency in kilohertz? • Solution • First we change 100 ms to seconds, and then we calculate the frequency from the period (1 Hz = 10−3 kHz).
Note • Frequency • Frequency is the rate of change with respect to time. • Change in a short span of time means high frequency. • Change over a long span of time means low frequency. • If a signal does not change at all, its frequency is zero. • If a signal changes instantaneously, its frequency is infinite. • Phase • Phase describes the position of the waveform relative to time 0.
Example 3.6 • A sine wave is offset 1/6 cycle with respect to time 0. What is its phase in degrees and radians? • Solution • we know that 1 complete cycle is 360°. Therefore, 1/6 cycle is
Time-domain and Frequency-domain of Single Wave • A complete sine wave in the time domain can be represented by one single spike in the frequency domain.
Example • The frequency domain is more compact and useful when we are dealing with more than one sine wave. For example, Figure 3.8 shows three sine waves, each with different amplitude and frequency. All can be represented by three spikes in the frequency domain.
Note • A single-frequency sine wave is not useful in data communications; • we need to send a composite signal, a signal made of many simple sine waves. • According to Fourier analysis, any composite signal is a combination of simple sine waves with different frequencies, amplitudes, and phases. (Appendix C)
Note • If the composite signal is periodic, the decomposition gives a series of signals with discrete frequencies; if the composite signal is nonperiodic, the decomposition gives a combination of sine waves with continuous frequencies.
Example 3.8 • Figure 3.9 shows a periodic composite signal with frequency f. This type of signal is not typical of those found in data communications. We can consider it to be three alarm systems, each with a different frequency. The analysis of this signal can give us a good understanding of how to decompose signals.
Example 3.9 • Figure 3.11 shows a nonperiodic composite signal. It can be the signal created by a microphone or a telephone set when a word or two is pronounced. In this case, the composite signal cannot be periodic, because that implies that we are repeating the same word or words with exactly the same tone.
Notes • The bandwidth of a composite signal is the difference between the highest and the lowest frequencies contained in that signal.
Example 3.10 • If a periodic signal is decomposed into five sine waves with frequencies of 100, 300, 500, 700, and 900 Hz, what is its bandwidth? Draw the spectrum, assuming all components have a maximum amplitude of 10 V. • Solution • Let fh be the highest frequency, fl the lowest frequency, and B the bandwidth. Then • The spectrum has only five spikes, at 100, 300, 500, 700, and 900 Hz (see Figure 3.13).
Example 3.11 • A periodic signal has a bandwidth of 20 Hz. The highest frequency is 60 Hz. What is the lowest frequency? Draw the spectrum if the signal contains all frequencies of the same amplitude. • Solution • Let fh be the highest frequency, fl the lowest frequency, and B the bandwidth. Then • The spectrum contains all integer frequencies. We show this by a series of spikes (see Figure 3.14).
Example 3.12 • A nonperiodic composite signal has a bandwidth of 200 kHz, with a middle frequency of 140 kHz and peak amplitude of 20 V. The two extreme frequencies have an amplitude of 0. Draw the frequency domain of the signal. • Solution • The lowest frequency must be at 40 kHz and the highest at 240 kHz. Figure 3.15 shows the frequency domain and the bandwidth.
Example 3.13 • An example of a nonperiodic composite signal is the signal propagated by an AM radio station. In the United States, each AM radio station is assigned a 10-kHz bandwidth. The total bandwidth dedicated to AM radio ranges from 530 to 1700 kHz. We will show the rationale behind this 10-kHz bandwidth in Chapter 5.
Example 3.14 • Another example of a nonperiodic composite signal is the signal propagated by an FM radio station. In the United States, each FM radio station is assigned a 200-kHz bandwidth. The total bandwidth dedicated to FM radio ranges from 88 to 108 MHz. We will show the rationale behind this 200-kHz bandwidth in Chapter 5.
Example 3.15 • Another example of a nonperiodic composite signal is the signal received by an old-fashioned analog black-and-white TV. A TV screen is made up of pixels. If we assume a resolution of 525×700, we have 367,500 pixels per screen. If we scan the screen 30 times per second, this is 367,500×30 = 11,025,000 pixels per second. The worst-case scenario is alternating black and white pixels. We can send 2 pixels per cycle. Therefore, we need 11,025,000 / 2 = 5,512,500 cycles per second, or Hz. The bandwidth needed is 5.5125 MHz.
DIGITAL SIGNALS In addition to being represented by an analog signal, information can also be represented by a digital signal. For example, a 1 can be encoded as a positive voltage and a 0 as zero voltage. A digital signal can have more than two levels. In this case, we can send more than 1 bit for each level.
Bit Per Level To send 1 bit per sample needs 2 levels To send 2 bits per sample needs 4 levels. In general, Need L levels to send log2L bits per sample.
Example 3.16 • A digital signal has eight (8) levels. How many bits are needed per level? We calculate the number of bits from the formula • Each signal level is represented by 3 bits.
Example 3.17 • A digital signal has nine levels. How many bits are needed per level? We calculate the number of bits by using the formula. Each signal level is represented by 3.17 bits. However, this answer is not realistic. The number of bits sent per level needs to be an integer as well as a power of 2. For this example, 4 bits can represent one level.
Example 3.18 • Assume we need to download text documents at the rate of 100 pages per minute. What is the required bit rate of the channel? • Solution • A page is an average of 24 lines with 80 characters in each line. If we assume that one character requires 8 bits, the bit rate is
Example 3.19 • A digitized voice channel, as we will see in Chapter 4, is made by digitizing a 4-kHz bandwidth analog voice signal. We need to sample the signal at twice the highest frequency (two samples per hertz). We assume that each sample requires 8 bits. What is the required bit rate? • Solution • The bit rate can be calculated as
Example 3.20 • What is the bit rate for high-definition TV (HDTV)? • Solution • HDTV uses digital signals to broadcast high quality video signals. The HDTV screen is normally a ratio of 16 : 9. There are 1920 by 1080 pixels per screen, and the screen is renewed 30 times per second. Twenty-four bits represents one color pixel. • The TV stations reduce this rate to 20 to 40 Mbps through compression.
The time and frequency domains of periodic and nonperiodic digital signals
Transmission of Digital Signals • Baseband transmission • Broadband transmission (using modulation)