Download
1 / 18
180 likes | 287 Vues
Coming Attractions from the Washington State Climate Impacts Assessment. Lara Whitely Binder Alan Hamlet Marketa McGuire Elsner Climate Impacts Group Center for Science in the Earth System University of Washington October 2, 2008 CIG Climate and Water Fall Forecast Meeting.

E N D
Coming Attractions from the Washington State Climate Impacts Assessment Lara Whitely Binder Alan Hamlet Marketa McGuire Elsner Climate Impacts Group Center for Science in the Earth System University of Washington October 2, 2008 CIG Climate and Water Fall Forecast Meeting Climate science in the public interest
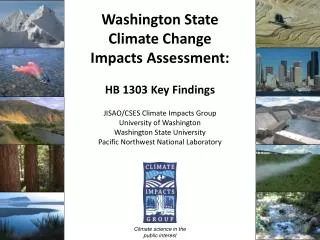
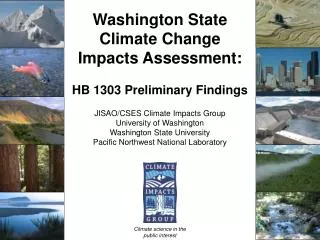
HumanHealth Infrastructure Water Resources Agriculture/Economics A comprehensive climate change impacts assessment for Washington State Coasts Energy Forest Resources Salmon Adaptation
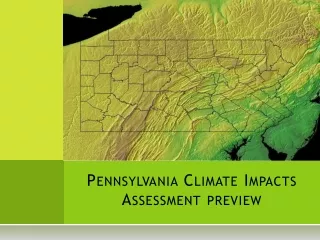
Project Domain: WA and the PNW To assess impacts in water and other sectors, the analysis must include all of the PNW = wide range of data available for all the PNW! Detailed case studies for water supply are being done for the Puget Sound Region and Yakima Basin
Hydrology and Water Resources Reduced snowpack and changes in soil moisture will occur. Declines in April 1 SWE vary between 35%-41% for the 2040s, depending on the emissions scenario.
Average annual SWE in the Yakima watershed above Parker is projected to be 31-68% of historic levels by the 2040s for two “middle of the road” scenarios • Winter streamflows increase as basin shifts to rain-dominant basin ** Preliminary results - subject to change**
Salmon Projected Maximum Weekly Average Water Temperatures – 2040s Increasing thermal stress likely to become most problematic for salmon in the interior Columbia River Basin. In Western WA salmon, increases in the magnitude of extreme high/low flows likely to be most problematic 49% of stations exceed the 21ºC (70°F) water quality criteria (changes relative to 2001-2007)
Agriculture • Longer growing seasons is projected, especially for summer crops. Range for the 2040s: +10 days for Franklin/Walla Walla counties to + 27 days for Whatcom County • Changes in spring and summer aridity projected in all agriculturally important counties • Diseases will generally become more problematic over the next century, especially as a result of warmer temperatures.
Energy Heating degree days will continue to dominate in the 2020s and 2040s, but cooling degree days become a much more important factor in eastern WA as the region warms.
Improved Access to Hydrologic Scenarios in the Columbia River Basin • Goals: • Create a comprehensive, up-to-date, self-consistent, publicly available hydrologic database to support long-range planning • Construct end-to-end process to allow updates of the database when new climate change scenarios are available Answers to FAQ regarding WA 2860 from the Department of Ecology website: http://www.ecy.wa.gov/pubs/0611014.pdf
Regional Study Partners • WA State Department of Ecology • Bonneville Power Administration • Northwest Power and Conservation Council • State of Oregon • Province of British Columbia (BC Hydro and The Ministry of Environment)
Survey Participant Agency/Organization Affiliation • 178 participants • State and Federal employees make up 60% of the participants
Survey Participant Management Areas • Water supply, ISF management, & hydropower production dominant management areas • In addition to entire PNW, Snake, Yakima, and Okanogan regions were identified as important
271 Sites Upper Columbia River Basin Yakima River Basin Kootenai River Basin Salmon River Basin Mainstem Columbia River Basin Willamette River Basin Snake River Basin
Survey Response – Data Needs • Fine resolution • Daily time step • Spatial maps of data anomalies/patterns of mean changes • Excel or ASCII (text) data format • Web or ftp data transfer
Sample Preliminary Spatial Maps Based on Delta Method Experiments