Quality Function Deployment
Quality Function Deployment. What is QFD?. A method of transferring customer needs and requirements into technical specifications for new product and service development. Brief History. Dr. Yoji Akao and Shigeru Mizuno First implemented at Mitsubishi Heavy Industries, Kobe Shipyard in 1972

Quality Function Deployment
E N D
Presentation Transcript
What is QFD? • A method of transferring customer needs and requirements into technical specifications for new product and service development.
Brief History • Dr. Yoji Akao and Shigeru Mizuno • First implemented at Mitsubishi Heavy Industries, Kobe Shipyard in 1972 • Toyota strongly influenced adoption of QFD in North America • Between 1977-1984 achieved a 61% reduction in product development cost, a 33% reduction in product development cycle, and virtual elimination of rust related warranty problems.
Overview of Development Process • Four Stages of The Development Process: • Design • Analysis • Development • Full Launch
Design • Service or product not profitable • Development strategy • Idea generation and screening • Service package or product architecture formulation • Production feasibility • Need to rethink the new offering or production processes Analysis Development • Detailed review of market potential and production costs • Post-launch review Full Launch • Detailed specifications • Process design • Marketing program design • Personnel training • Testing and pilot runs • Market promotions • Sales personnel briefed • Distribution processes activated • Old services or products withdrawn • Production of new offering and ramp-up Overview of Development Process (Cont’d) Figure 2.2
Quality Function Deployment Commonly Asked Questions (QFD)
Where Does QFD Fit? Everywhere !
Quality Function Deployment Capturing/Applying Customer Data
Capturing/Applying Customer DataHow do we define a customer? ? “Who must be satisfied with the product in order for the product to be considered successful?"
Defining Customers • Users who are concerned with functionality. • Management who is concerned with financial and strategic issues. • Distribution and Purchasing Agents who are concerned with purchase transaction and availability issues. • Internal workers who are concerned with how the product will affect the quality of their work life.
Capturing Customer Requirements • One on one customer interviews • Focus groups • In-context customer visits
Applying Customer Data Prioritizing Requirements
Prioritizing Requirements • Importance to the Customer • Our Current Product • Competitor One • Competitor Two • Our Future Product • Improvement Factor • Overall Importance • Percent Importance
Benchmarking • Why Benchmark? • Establishes a definition to the level of real performance required to produce the desired level of perceived performance • Develop a product or service which will excite the customer and get him/her to purchase your product
Benchmarking • Who Should we benchmark? • The same products or services for which they captured performance perceptions • A good policy is to benchmark products across the whole spectrum of performance • Benchmarking all of the competitive products is not required; just check representative products
Benchmarking • How do we capture the results? • Translate the raw benchmark data directly and associate that data with the appropriate measure • Translate the raw benchmark data into the same scale as was used to capture the perceived performance ratings
Target Values The final goal of many QFD projects is to set the target values for the design measures. Benchmarking values must meet or exceed target values
Defining Actions • The final result of the QFD process • To develop a comprehensive product specification • Answers the question: “What actions do we need to take to achieve the targets that we have set in order to satisfy our customers?"
Seven Management and Planning Tools • Affinity Diagrams • Relations Diagrams • Hierarchy Trees (Tree Diagram) • Matrices And Tables. • Process Decision Program Diagrams (PDPC) • Analytic Hierarchy Process (AHP) • Blueprinting
Affinity Diagrams • Method utilized by teams to organize/gain insight into a set of qualitative information, (i.e. voiced customer requirements). • Developed to discover meaningful groups of ideas within a raw list.
Affinity Diagrams (Cont) • Ishikawa recommends using the affinity diagram when facts or thoughts are uncertain and need to be organized, when pre-existing ideas or paradigms need to be overcome, when ideas need to be clarified, and when unity within a team needs to be created.
Relations Diagrams • Drawn to show all the different relationships between factors, areas, or processes. • Facilitates the selection of factors that drive many of the other symptoms or factors.
Hierarchy Trees (Tree Diagram) • Illustrates the structure of interrelationships between groups of statements • Built from the top down in an analytical manner. • Applied to an existing set of structured information, such as that produced by building an Affinity Diagram and then used to account for flaws in the data.
Matrices And Tables • A series of related matrices and tables used as the tool for translating the voice of the customer • First to design specifications • Second to more detailed part characteristics • Third to show the necessary process and technology characteristics • Finally to show the specific operational conditions for the production phase
Process Decision Program Diagrams (PDPC) • PDPC are used to study potential failures of new processes and services
Analytic Hierarchy Process (AHP) • AHP uses pair wise comparisons on hierarchically organized elements to produce an accurate set of priorities.
Blueprinting • Blueprinting is a tool used to illustrate and analyze all the processes involved in providing a service.
Different Modes of Application • Four Phase Approach • Translate customer wants into Product characteristics • Translate Product characteristics into Part Characteristics • Part characteristics into Product Characteristics • Finally, Product into Production Controls
Different Modes of Application • Matrix of Matrices Approach
Different Modes of ApplicationMatrix of Matrices Approach • Used to address wide variety of development issues • Uses specific matrices for each specific development issue
Different Modes of Application • Concept Selection Approach
Different Modes of ApplicationConcept Selection Approach • Was developed for implementing concurrent engineering practices • Evaluating the wants and needs from all different types of customers • Integrates the principles of concept selection to help development teams to objectively and evaluate alternatives
Different Modes of ApplicationWhich Approach Should You Choose? • Depends on your individual Product Needs • Each System can be modified to suit specific situations WHich ONe?
House Of Quality • A popular assembly of several deployment hierarchies and tables, including the • Demanded Quality Hierarchy • Quality Characteristics Hierarchy • Relationships Matrix • Quality Planning Table • Design Planning Table
House Of Quality (Cont) • This technique is a type of conceptual map providing means to the inter-functional planning and coordination in product improvement and development. • This method brings the customer needs in the focus to design/ redesign the product and service
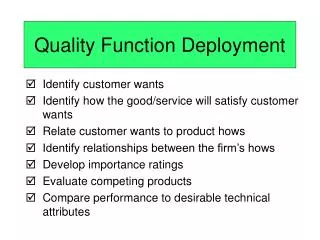
To Build The House Of Quality • Identify Customer Wants • Identify How The Good/Service Will Satisfy The Customer’s Wants • Planning Matrix • Interrelationship matrix • Technical correlation (Roof) matrix • Technical priorities, benchmarks and targets
Step 1 • Identify Customer Wants • A structured list of requirements derived from customer statements
Step 2 • Identify How The Good/Service Will Satisfy The Customer’s Wants • A structured set of relevant and measurable product characteristics.
Step 3 • Planning Matrix • Illustrates customer perceptions observed in market surveys • Includes relative importance of customer requirements, company and competitor performance in meeting these requirements
Step 4 • Interrelationship matrix • Illustrates the QFD team's perceptions of interrelationships between technical and customer requirements • An appropriate scale is applied, illustrated using symbols or figures. • Filling this portion of the matrix involves discussions and consensus building within the team and can be time consuming • Concentrating on key relationships and minimizing the numbers of requirements are useful techniques to reduce the demands on resources
Step 5 • used to identify where technical requirements support or impede each other in the product design • Can highlight innovation opportunities
Step 6 • Technical priorities, benchmarks and targets • Used to record the priorities assigned to technical requirements by the matrix • Measures of technical performance achieved by competitive products • The degree of difficulty involved in developing each requirement • The final output of the matrix is a set of target values for each technical requirement to be met by the new design, which are linked back to the demands of the customer
Benefits Of Adopting QFD • Reduced time to market • Reduction in design changes • Decreased design and manufacturing costs • Improved quality • Increased customer satisfaction