
Uploaded by
ilario
4 SLIDES
200 VUES
40LIKES
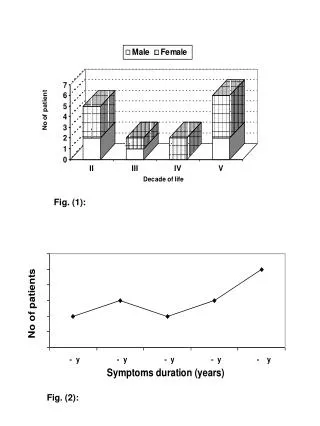
Understanding Figures in a Multi-Dimensional Dataset Analysis
DESCRIPTION
This text analyzes a series of figures, denoted from Fig. 1 to Fig. 7, that illustrate the relationships and patterns within a given multi-dimensional dataset. Each figure represents distinct variables and their interactions. The analysis highlights key findings, methodologies employed, and the significance of these figures in understanding the overall dataset. Visual aids such as these are crucial for comprehending complex information and deriving actionable insights, thereby informing future research and development within the field.
Download
1 / 4
Télécharger la présentation 
Understanding Figures in a Multi-Dimensional Dataset Analysis
An Image/Link below is provided (as is) to download presentation
Download Policy: Content on the Website is provided to you AS IS for your information and personal use and may not be sold / licensed / shared on other websites without getting consent from its author.
Content is provided to you AS IS for your information and personal use only.
Download presentation by click this link.
While downloading, if for some reason you are not able to download a presentation, the publisher may have deleted the file from their server.
During download, if you can't get a presentation, the file might be deleted by the publisher.
E N D
More Related