Download
1 / 32
320 likes | 477 Vues
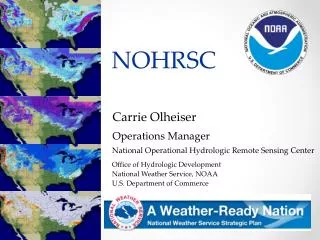
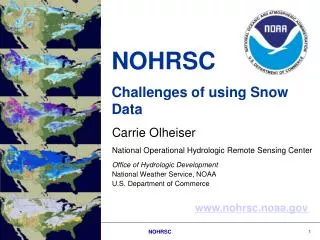
NOHRSC Challenges of using Snow Data . Carrie Olheiser. National Operational Hydrologic Remote Sensing Center. Office of Hydrologic Development National Weather Service, NOAA U.S. Department of Commerce. www.nohrsc.noaa.gov. Snow Modeling and Data Assimilation. Snow Information Products.

E N D
NOHRSC Challenges of using Snow Data Carrie Olheiser National Operational Hydrologic Remote Sensing Center Office of Hydrologic Development National Weather Service, NOAA U.S. Department of Commerce www.nohrsc.noaa.gov
Snow Modeling and Data Assimilation Snow Information Products Data Products Interactive Maps Time Series Plots Text Discussions Numerical Weather Prediction Model Forcings Gridded Snow Characteristics U.S. 1-km2 Hourly National Snow Analyses (NSA) Multi-sensor Snow Observations Ground Airborne Satellite
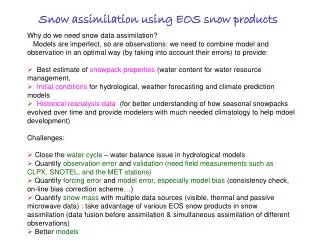
Challenges of snowdata • Nature of snow observations. Difficult to get “representative” observation. • Metadata inconstancies between sources. • Data in proper SHEF format including time, amount and duration. • Snowfall observations are not always published in a standard format. • Timeliness of data • Reliably and timing of observations. • Adequate training in data collection. • Quality controlling the data, who is responsible?
Quality Controlling of Data • NOHRSC performs 4 automated tests • Reasonable Range • Spatial Consistency • Temporal Consistency • Internal Consistency • Reasonable range is the only QC test Snowfall data undergoes.
Manual Quality Control Spatial Consistency These points need to be looked at more closely, not spatially consistent
Manual Quality Control Temporal Consistency Unstable SNOTEL Observation In early season and late season Bad Observation Using data operationally does not allow us to see into the future for temporal quality control.
Manual Quality Control Internal Consistency • Density Check
Station Representativeness Point in Pixel ESTES PARK RAWS
Point in Pixel Consistency ? • Elevation • Differences in station elevation and 1 km X1 km DEM elevation vary as much as 1500 meters, example station KRWW4, • DEM elevation = 1439 • Reported elevation = 2910 • Forest Cover Density • Photos from the Northwest SNOTEL sites and model forest cover density disconnects. • Example from Caribou Maine and station KCAR.
Disconnects between ground survey coop results for the March 1 to March 4 SurveyForest Density Issues and Stations not representative of the region. • Caribou, ME • SWE reported March 1, 2004 is 0.038 meters. • KCAR is a Coop Station located at the Airport in the large wind swept location that is well exposed with a forest density of ~ 6%. • Caribou, ME SJ snow survey site . • SWE reported March 1, 2004 is 0.104 meters. • This station is reported by the USGS and measured at the medical clinic which is a more heavily wooded area. Assimilation for the region used KCAR a regular reporter in the season but turns out it was not representative of the region. This was not the only station with similar issues.
History of NOHRSC Snowfall Products • It was agreed at the NWS 2004 Cold Regions Hydrology Workshop (Kansas City, 2004 November 15-19) that the NOHRSC would develop web-based, real-time, automated, interactive, snowfall maps for the CONUS.
National Metadata Sources Over 40 different sources of station metadata National Weather Service Databases NWSLI, MADIS, CSSA (B44’s), NWS-ICAO, NWS-METAR, HADS, NCDC Weather Forecast Offices, River Forecast Centers and Regional Offices Federal and State Agencies NRCS SNOTEL and Snow Courses USACE New England District Snow Surveys New York City Dept. Environmental Protection Federal Aviation Administration California Department of Water Resources Maine Cooperative Snow Survey MesoWest (150 + Smaller mesonets) RAWS Remote Automated Weather Stations Often redundant, often inconsistent! NEED ONE-STOP SHOPPING FOR STATION METADATA
Importance of Accurate Metadata • Numerous databases leads to uncertainties in the station metadata.
Boulder Creek, Oregon 99 Miles
Quality Control of Data • Internal Quality Control • Manual Quality Control • Point in Pixel Consistency
Internal Quality Control • Behind the scenes 4 QC tests are run • Reasonable Range • Spatial Consistency • Temporal Consistency • Internal Consistency • Problems with losing to much data if we have strict requirements in an automated quality control scheme. • The nature of snow variability makes qc difficult and as much data is needed as possible.
PRODUCTS • Hourly and Daily • 1 km2 Resolution • INTERNET • Interactive Maps • 3D Visualization • e.g. Google Earth • Time-series loops • National/Regional Discussions • Text summaries by watershed • Point Queries • DIRECT FEED • Push or Pull • Gridded Data • Flat Binary or GIS-ready
History of NOHRSC Snowfall Products • It was agreed at the NWS 2004 Cold Regions Hydrology Workshop (Kansas City, 2004 November 15-19) that the NOHRSC would develop web-based, real-time, automated, interactive, snowfall maps for the CONUS.
NOHRSC Snowfall Products • NOHRSC has seven (7) new snowfall maps to the NOHRSC selection of Physical Elements on the NOHRSC Interactive Snow Information page. • Daily total snowfall observations (for previous 24 hours) • 2-day total snowfall observations (for previous 48 hours) • 3-day total snowfall observations (for previous 72 hours) • Daily total snowfall interpolation (for previous 24 hours) • 2-day total snowfall interpolation (for previous 48 hours) • 3-day total snowfall interpolation (for previous 72 hours) • 24-hr Raw Snowfall – Only displays 24 hour totals
NOHRSC Snowfall Products • Are generated in automated process that uses snowfall data encoded in SHEF and MADIS formats received at the NOHRSC over AWIPS and MADIS Snow Collective. • The NOHRSC performs only a “reasonable range” quality-control test on the snowfall data. • Snowfall maps are generated using both • Temporal • quantization and integration • spatial interpolation • inverse distance weighting with a search radius of 75km.
Snowfall Text Products Raw Data Available for Download
Cumulative Snowfall Product • Two stations located a couple kilometers apart. Both reporting snowfall, but MITM2 is reporting zero snowfall. • Some station do not have a continuous record of snowfall, missing significant events. These products need to be used with a watchful eye!