Download
1 / 9
90 likes | 201 Vues
This overview covers essential aspects of high-energy computing and data analysis in particle physics. Learn how raw signals are transformed into analyzable data and explore strategies for simulating the Large Hadron Collider (LHC) output. We discuss the rapid transfer of analyzable events to workstations, data archiving, and parameter extraction from event records. Discover methods for condensing vast amounts of data into meaningful visualizations, the event format structure, and essential techniques like histogramming with ROOT. Ideal for those wishing to deepen their understanding of ATLAS data processing.

E N D
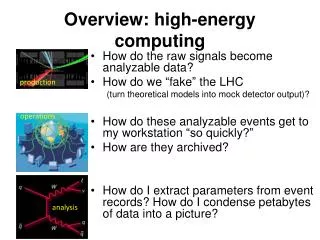
Overview: high-energycomputing • How do therawsignalsbecomeanalyzable data? • How do we “fake” the LHC (turntheoreticalmodelsintomock detector output)? • How do theseanalyzableeventsgetto my workstation “so quickly?” • How are theyarchived? • How do I extractparametersfromeventrecords? How do I condense petabytesof data into a picture? analysis production operations
Analysiswith ROOT • How do I extractparametersfromeventrecords? How do I condense petabytesof data into a picture? analysis
Data is stored in many formats… convert trigger bytestream RDO (raw) fast pattern recognition event sorting esd D3PD reconstruction MERGE& derive aod note: you’ll see these acronyms often… aod pattern recognition more sorting tag
Simulation: treated the same way! MONTE CARLO PRODUCTION CHAIN RDO (raw) esd D3PD RECO MERGE & derive aod aod tag
Theeventformat: tracks calorimeter clusters electron muon metadata
The event format in software event Organized by event (quadrillionswitnessed in 2012!) • event-wide information • Examples: metadata; sum of measured transverse energy • physics object lists: • muons, electrons, taus… • tracks of charged particles • “truth” particles… • object properties: • e.g. “hits” on tracks µ jet jet tau track track track track track track track track hit track hit
Condensingtheinformation • how can wemakethat “jungle” look more like a Higgsboson?
Histograms! Pseudocode: histo = makeHisto(nbins=50, firstbin=0*GeV, lastbin=200*GeV) for thisEvent in allEvents: if HasZ( thisEvent ): m = recoZMass( thisEvent ) histo.FillWith( m ) • “Hello World”for HEP computing: making a histogram TH1F(“name”, “title; x title; y title”, nBins, firstBinValue, LastBinValue) TH1F::Fill(value,weight)
getting to the fun part: Are you into installing/basic histogramming? Are youreadyforprocessing/understanding ATLAS data? TTrees, treeloops, TSelectors, pythontreeaccess Commonhomework: the Duke D3PD Dictionary • ROOT installation • The DUKE ROOT tutorial: • exercises by Al Goshaw • helpfrom Neil, others… • The ATLAS ROOT tutorial: • also a nicewaytotry out yournew ATLAS computingaccount!