Download
1 / 17
170 likes | 314 Vues
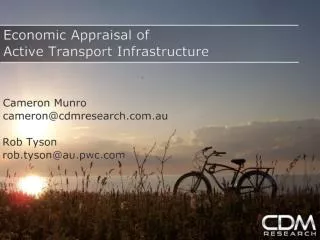
Topics. Are all regions of Melbourne “booming”? Growth by gender Origin-destination flows Is census “representative”?. We are a community , not an economy !. Objective. Develop an Australian-specific active transport appraisal framework. Be practical.

E N D
Topics • Are all regions of Melbourne “booming”? • Growth by gender • Origin-destination flows • Is census “representative”? We are a community, not an economy!
Objective • Develop an Australian-specific active transport appraisal framework. • Be practical. • Be consistent with standard transport appraisal. • Be cognisant of the limitations.
Contributions • Spreadsheet tool • Explicit recognition of uncertainty • Australian-specific unit values • Diversion rates • Injury risk submodel
Diversion rates: ‘rules of thumb No shift from PT outside inner city area Very little mode shift from car Most demand is reassigned More induced demand in outer urban and rural areas
Rules of thumb Approximate discounted benefits over 30 years per 1,000 users per day: Inner urban benefits are lower because more demand is reassigned, as opposed to more induced demand in other areas Pedestrians produce greater benefits because of higher health benefits per km and more induced travel than cycling, but travel much shorter distances
Example 1: Inner City Bridge • Assume active transport capital cost is 5% of total project cost (5% x $338m = $16.9m) • Average daily demand is 1,100 cyclists and 500 pedestrians • Average cycling trip is 10 km, walking is 3.75 km (i.e. 45 min @ 5 km/h) • Bridge reduces travel distance by 300 m
Benefit-Cost Ratio (BCR) Best estimate: 1.0 45% chance that BCR < 1.0 95% confidence interval: 0.6 – 1.4
Discounted benefits Travel time benefits due to shorter distance Health benefits are very significant Vehicle-related benefits are small
Discounted benefits: Breakdown Active transport less safe Shorter distance Shorter distance Less travel on-road
Conclusion • ATC / Austroads guidelines update • Public realm valuation • Further research • Health values • Injury risk