PET/CT Segmentation Challenge: Multi-Site Comparison & Algorithm Performance Evaluation
10 likes | 101 Vues
This study presents the results of a PET/CT Segmentation Challenge focusing on lung nodule segmentation algorithms. The challenge evaluated intra- and inter-algorithm agreement, bias, and repeatability of volumes using phantom and clinical data. Various sites and algorithms participated, demonstrating variability and performance differences. Future plans include assessing feature impacts and exploring new challenges using DICOM-SEG. The challenge data featured objects from different collections.

PET/CT Segmentation Challenge: Multi-Site Comparison & Algorithm Performance Evaluation
E N D
Presentation Transcript
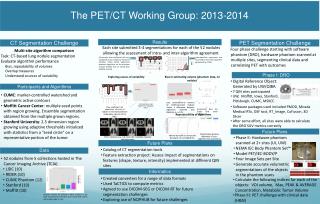
The PET/CT Working Group: 2013-2014 Results CT Segmentation Challenge PET Segmentation Challenge Informatics Issues Each site submitted 3-4 segmentations for each of the 52 nodules allowing the assessment of intra- and inter-algorithm agreement Four phase challenge starting with software phantom (DRO), hardware phantom scanned at multiple sites, segmenting clinical data and correlating PET with outcomes • Multi-site algorithm comparison • Task: CT-based lung nodule segmentation • Evaluate algorithm performance • Bias, repeatability of volumes • Overlap measures • Understand sources of variability All pairwise dice coefficients (all runs, all algorithms by nodule) by collection indicates shows better agreement between algorithms on the phantom nodules (CUMC) than on clinical data (ANOVA, p<0.05) Intra-algorithm agreement was much higher than inter-algorithm agreement (p <0.05) Phase I: DRO Bias in estimating volume (phantom data, 12 nodules) Exploring causes of variability • Digital Reference Object: Generated by UW/QIBA • 7 QIN sites participated • UW, Moffitt, Iowa, Stanford, Pittsburgh, CUMC, MSKCC Participants and Algorithms • CUMC: marker-controlled watershed and geometric active contours • Moffitt Cancer Center: multiple seed points with region growing. Ensemble segmentation obtained from the multiple grown regions. • Stanford University: 2.5 dimension region growing using adaptive thresholds initialized with statistics from a “seed circle” on a representative portion of the tumor Bias (estimated-true volume) for CUMC-phantom nodules shows a difference between algorithms (ANOVA with blocking, p <<0.05) Estimated volume by algorithm for highlighted nodule • Software packages used included PMOD, Mirada Medical RTx, OSF tool, RT_Image, CuFusion, 3D Slicer • After some effort, all sites were able to calculate the DRO SUV metrics correctly Dice coefficient (all algorithms, all runs) of nodules in Stanford collection (ordered by volume left to right) Examining bias for large and small nodules Reproducibility of algorithms Future Plans Statistically significant difference in intra-algorithm Dice coefficients Volume by lesion as measured by repeat runs of algorithms • Phase II: Hardware phantom scanned at 2+ sites (UI, UW) • NEMA IEC Body Phantom Set™ • Model PET/IEC-BODY/P • Four Image Sets per Site • Generate accurate volumetric segmentations of the objects in the phantom scans Some nodules (e.g., Lg) have high variability (typically heterogeneous) Future Plans . • Catalog of CT segmentation tools • Feature extraction project: Assess impact of segmentations on features (shape, texture, intensity) implemented at different QIN sites Data • 52 nodules from 5 collections hosted in The Cancer Imaging Archive (TCIA) • LIDC (10) • RIDER (10) • CUMC Phantom (12) • Stanford (10) • Moffitt (10) Informatics • Created converters for a range of data formats • Used TaCTICS to compute metrics • Agreed to use DICOM-SEG or DICOM-RT for future segmentation challenges • Exploring use of NCIPHUB for future challenges • Calculate the following indices for each of the objects: VOI volume, Max, PEAK & AVERAGE Concentration, Metabolic Tumor Volume • Phase III: PET challenge with clinical data (H&N) Nodules volume by collection. Most nodules in the LIDC and phantom collection were small while others had a wide range of sizes