Download
1 / 21
210 likes | 327 Vues
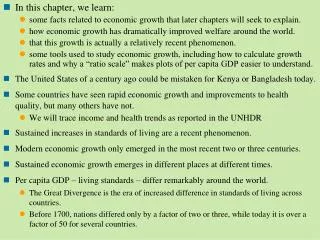
Chapter 5 In this chapter we will study how a nation’s standard of living is measured by GDP. GDP (gross domestic product) is the market value of all final goods and services produced within a country in a given time period.

E N D
Chapter 5 In this chapter we will study how a nation’s standard of living is measured by GDP. GDP (gross domestic product) is the market value of all final goods and services produced within a country in a given time period. To understand how GDP is measured, we return to the circular flow model:
The circular flow model illustrates that:Expenditure = IncomeThe left-hand side of the circle equals the right-hand side. When the firms produce output that is purchased by the spenders in the economy, the firms necessarily also generate factor income equal in value to the output they have produced.
Let Y = income = value of output. The circular flow model shows that:Y = C + I + G + NX. It follows that there are two methods that can be used to measure GDP:1. The expenditure approach2. The income approach
The Expenditure ApproachWe simply add up all of the expenditures on final goods and services on the right-hand side of the circular flow diagram: GDP = C + I + G + NX This calculation will give us the value of all output produced in the economy, evaluated in terms of market prices.
The Income ApproachWe start by adding up all of the different forms of factor income paid in the economy:
Compensation of employees + Net interest + Rent + Profit _______________________________= Net domestic product at factor cost “Net” because firms’ profits are net of depreciation.“At factor cost” because goods are valued in terms of the factors used to produce them.
The expenditure approach gives GDP, which includes depreciation, evaluated at market prices. Therefore, to make the income approach consistent with the expenditure approach, we must: Convert factor costs to market prices: add indirect taxes subtract subsidies Convert net domestic product to gross: add depreciation
Net domestic product at factor cost + indirect taxes - subsidies + depreciation _______________________________= Gross domestic product at market prices
Real versus nominal GDPGDP is measured at market prices, i.e., in dollars. If this dollar amount increases, it could be because we produced more goods and services (our standard of living increased), or prices increased (our cost of living increased)
An increase in the current dollar value of output produced is called an increase in nominal GDP. An increase in the amount of output produced is called an increase in real GDP. Nominal GDP could increase either because of an increase in real GDP or because of an increase in the average level of prices in the economy, or because both happened. An increase in the price level is measured by the GDP deflator.
Nominal GDP is the value of final goods and services produced in a given year evaluated in terms of the prices prevailing in that same year Real GDP is the value of final goods and services produced in a given year evaluated in terms of the prices prevailing in a base year, i.e., holding prices constant at base-year levels.
Traditional, and simplest, method of calculating real GDP: Assume that the economy produces only two goods, beer and pretzels. 2006 is the current year; 2005 is the base year. In the base year, nominal GDP and real GDP are the same. Nominal GDP = real GDP in 2005 is calculated by adding up the values of beer and pretzels produced in 2005 in terms of 2005 prices:
Total $235.50 $235.50 is nominal GDP and real GDP in 2005.
Nominal GDP in 2006 is the value of beer and pretzels produced in 2006 in terms of 2006 prices: Total $795 $795 is nominal GDP in 2006.
Real GDP in 2006 is the value of beer and pretzels produced in 2006 in terms of 2005 prices: Total $330 $330 is real GDP in 2006, i.e., the value of output produced in 2006 evaluated at base-year (2005) prices. Thus, in constant 2005 prices, real GDP increased from $235.50 to $330, a 40% increase.
The traditional approach to calculating real GDP uses base-year prices. The more modern approach, also called the “chained-dollar method,” takes into account what happens when changes in output are evaluated at constant current-year prices. To implement the modern approach, we calculate the value of beer and pretzels produced in 2005 in terms of 2006 prices:
Total $627 $627 is the value of output produced in 2005 in terms of 2006 prices. This number may be compared with $795, which is the value of output produced in 2006 in terms of 2006 prices. Thus, at constant 2006 prices, output increased from $627 to $795, a growth rate of 27%.
The modern method of calculating real GDP takes the geometric average of the 40% increase in the value of output holding prices constant at 2005 prices and the 27% increase in the value of output holding prices constant at 2006 prices: 40 X 27 = 32.86%. Thus, real GDP, according to this approach, has increased by 32.86% from 2005 to 2006. In 2005 real GDP was $235.50. Therefore real GDP in 2006 must be 32.86% greater than $235.50, or $312.88.
The GDP deflatorThe GDP deflator is a measure of the average change in prices between the base year and a current year. It is calculated as an average of current prices expressed as a percentage of base-year prices:GDP deflator = (Nominal GDP/Real GDP) x 100
In our example, the GDP deflator is given by: GDP deflator in 2005 = ($235.50/$235.50) x 100 = 100 GDP deflator in 2006 = ($795/$312.88) x 100 = 254 Thus prices in our economy increased by 154% between 2005 and 2006.