Bioinformatics and Computational Biology
10 likes | 240 Vues
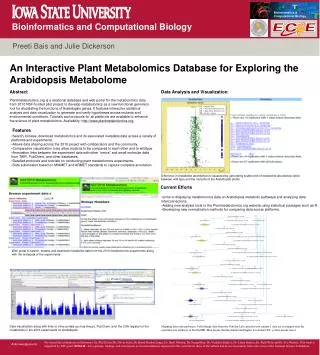
Bioinformatics & Computational Biology. Bioinformatics and Computational Biology. Preeti Bais and Julie Dickerson. An Interactive Plant Metabolomics Database for Exploring the Arabidopsis Metabolome. Abstract. Data Analysis and Visualization :.

Bioinformatics and Computational Biology
E N D
Presentation Transcript
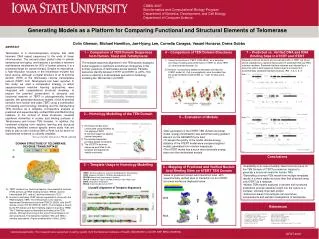
Bioinformatics & Computational Biology Bioinformatics and Computational Biology Preeti Bais and Julie Dickerson An Interactive Plant Metabolomics Database for Exploring the Arabidopsis Metabolome Abstract Data Analysis and Visualization: Plantmetabolomics.org is a relational database and web portal for the metabolomics data from 2010 NSF-funded pilot project to develop metabolomics as a new functional genomics tool for elucidating the functions of Arabidopsis genes. It features interactive statistical analysis and data visualization to generate and verify hypotheses across mutants and environmental conditions. Tutorials and protocols for all platforms are available to enhance the science of plant metabolomics. Availability: http://www.plantmetabolomics.org. Features • Search, browse, download metabolomics and its associated metadata data across a variety of platforms and experiments. • Allows data sharing across the 2010 project with collaborators and the community. • Comparative visualization tools allow mutants to be compared to each other and to wildtype. • Annotation links between the experiment data with other “omics” and small molecule data from TAIR, PubChem, and other databases. • Detailed protocols and tutorials on conducting plant metabolomics experiments. • Data submission based on MIAMET and ARMET standards to capture complete annotation. Difference in metabolite abundance is visualized by generating scatter plot of metabolite abundance ratios between wild type and the mutants of the Arabidopsis plants. Current Efforts • Links to displaying metabolomics data on Arabidopsis metabolic pathways and analyzing data interconnections. • Adding new analysis tools to the Plantmetabolomics.org website using statistical packages such as R. • Developing new normalization methods for comparing data across platforms. Web portal to search, browse and download metabolite data from the 2010 metabolomics experiments along with the metadata of the experiments. Data visualization along with links to other portals such as Aracyc, PubChem, and the CAS registry for the metabolites in the 2010 experiments for Arabidopsis. Mapping data onto pathways. Fold change data from the Nikolau Lab cuticular wax mutant 1 data set is mapped onto the cuticular wax pathway in MetNetDB. Blue means that the mutant had higher levels than WT, yellow means lower. We would like to thank our collaborators Dr. Phil Dixon, Dr. Oliver Fiehn, Dr Bernd Markus Lange, Dr. Basil Nikolau, Dr. Seung Rhee, Dr. Vladimir Shulaev, Dr. Lloyd Sumner, Dr. Ruth Welti and Dr. Eve Wurtele. This work is supported by NSF grant #0520140 . Any opinions, findings, and conclusions or recommendations expressed in this material are those of the authors and do not necessarily reflect the views of the National Science Foundation. Acknowledgements