Download
1 / 41
410 likes | 531 Vues
Parameters of the Digital Divide. Mack Shelley RISE, ELPS, Statistics, Iowa State University Lisa Thrane RISE, Iowa State University Stuart Shulman Environmental Science and Policy Program, Drake University. Prepared for Science and Society Seminar Series, September 30, 2003.

E N D
Parameters of the Digital Divide Mack Shelley RISE, ELPS, Statistics, Iowa State UniversityLisa Thrane RISE, Iowa State University Stuart Shulman Environmental Science and Policy Program, Drake University Prepared for Science and Society Seminar Series, September 30, 2003
The Digital Citizenship Project • An outgrowth of eRulemaking research • Audiences raise digital divide questions • Creates a Digital Citizenship course • ENV/POLS 052 covers the digital divide debate, impact on politics, and Lessig’s Code • Requires a 1-credit service-learning lab • ENV/POLS 053 teaches/enacts lesson plans focused on entry-level computer skills • Student/community collaboration • Identify problems & solutions • Service-learning & research design can clash • Ex., Reciprocity and randomization
Service-Learning Theory • One useful definition • Service-Learning is a method of teaching and learning which engages students in solving problems and addressing issues in their school or greater community as part of a total educational program. • Motivation for service • “To teach is to learn twice” – Joseph Joubert • Learning to think like a researcher • Participant observers • A critical role for classroom reflection
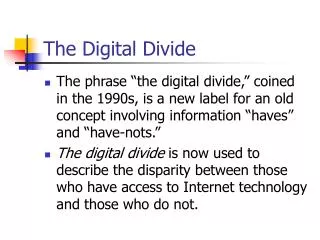
“Falling Through the Net” • “raising the level of digital inclusion … is a vitally important national goal … Internet access is no longer just a luxury item” • US Department of Commerce • Information literacy an increasingly critical component of citizenship • eGov leaves many behind
Drake students engaged inservice-learning with Polk Co. seniors
Senior Citizen Clientele • Survey (n=90) administered to suburban seniors in Des Moines • 62% over 70; 85% White; 65% female • 75% have computers at home • Over 2/3 have limited computer skills • 58% report no experience with the World Wide Web • 29% low skill • 10% contact public officials via Internet • Majority do not want elections held on the Internet • 65% do not believe that the Internet should empower citizens to be politically involved
Student Reflection “Before this class, I didn’t know what digital citizenship was. At the Social Security Administration, you can’t talk to someone directly without going through technological jumping jacks. I couldn’t imagine someone who was relatively poor, old, and uneducated trying to find out what their income was. You have to be technologically savvy to do these kinds of things. I had no knowledge of this prior to class, and this affects millions of people in the US.”
Student Reflection “It is too much to expect people to become digital citizens right away. It is part of a process . . . spending time with a Drake student or on their own. When you spend more time on the Internet, you realize you can look up any possible thing, or any small question you ever wondered about. Help finding this information is important as far as digital citizenship. Clients are used to not having everything at their fingertips, you have to show them that they do.”
Overview of Research • Two major research questions 1) How do race and education influence attitudes toward information technology? 2) What are the effects of these attitudes on digital government?
Data & Methods • Sample • Mail survey administered to randomly selected adults in a moderate-size Midwestern city in 2002 • Treatment Group • Selected from a low-income urban population • Received a brochure inviting them to attend free computer classes • Remaining participants formed a control group • Response rate was very low • 3% (n = 66) from treatment group, 6% (n = 101) from control group
Measures & Analysis • Survey instrument measures • Desire for Computer Skills • Technological Information Power • Computer Use • Digital Government • Computer Access Equity • Factor analysis • Structural equation model (LISREL 8.30)
Reduced Model Χ2 (11) = 12.61 (p = .35) GFI = .98 AGFI = .94 NFI = .90
Preliminary Findings • As education declines, desire for computer skills increases • Individuals with higher levels of education are more likely to use computers at home and work • Non-whites are more likely to report technological information key to empowerment • Non-Whites show greater interest in learning computer skills • Non-Whites more likely to suggest that computers should be accessible to all citizens
Preliminary Findings (continued) • Interest in developing computer skills is positively associated with digital citizenship • Viewing technology as a source of informational power is positively related to digital government • Technological informational power increases beliefs in computer access equity • The path model demonstrates some predictors may have an intervening effect on outcomes • These indirect effects are marginal
Preliminary Findings (continued) • An indirect effect was found between race and computer access equity through technological information power • Direct effect accounted for 78% of the total effect • Education decreased support for digital government through desire for computer skills • Effect of race on digital government influenced by technological information power • Less so through desire for computer skills
Conclusions to Date • Community members, particularly in economically and racially vulnerable groups, lack basic computer skills • Educationally advantaged groups report greater use of computers in their daily lives • Citizens must have a baseline of ITL to take advantage of Internet access • Information technology appears to be widening the gap between the IT literate and those without basic navigational skills
Conclusions to Date (continued) • Non-Whites are significantly more likely to believe informational technology is a valuable source of power • Translates into a somewhat greater belief in computer access equity • Non-Whites report significantly more desire than do Whites for equal access to computers and the Internet • Positive attitudes toward technology, an intervening variable, correlate with respondents being more likely to report a need to provide computers to the public
Conclusions to Date (continued) • There is a direct linkage between a desire for computer proficiency and digital citizenship • Education only a minor influence on this outcome • Potentially, service-learning is a well-suited intervention to bridge the divide between disenfranchised groups and digital citizenry • Quasi-experimental assessments of the effects of service learning interventions on ITL are underway
Future Research • National CATI Survey (3 states) by ISU’s Center for Survey Statistics and Methodology • Colorado, Iowa, Pennsylvania • Larger sample size • Randomization • Expanded and refined questionnaire • More elaborate models possible • But, still a low response rate
Overview of CATI National Survey • Colorado • 157 respondents unweighted (31.3% response rate) • 104 respondents weighted • Iowa • 171 respondents unweighted (37.4% response rate) • 71 respondents weighted • Pennsylvania • 150 respondents unweighted (26.7% response rate) • 303 respondents weighted
Some Preliminary Results from the CATI National Survey • How often do you vote in state and national elections? • “Always” • 61.4% for those with a home computer • 53.3% for those without a home computer • “Never” • 8.0% for those with a home computer • 19.3% for those without a home computer
Preliminary CATI Survey Results (continued) • How often do you vote in local elections? • “Always” • 40.4% for those with a home computer • 44.5% for those without a home computer • “Never” • 12.5% for those with a home computer • 23.4% for those without a home computer
Preliminary CATI Survey Results (continued) • Extent of political participation • “A great deal” • 3.2% for those with a home computer • 2.9% for those without a home computer • “Not at all” • 25.5% for those with a home computer • 40.1% for those without a home computer
Preliminary CATI Survey Results (continued) • Email is a good way to contact officials • “Strongly Agree” • 19.6% of those using a computer at work • 13.7% of those not using a computer at work • 17.3% of those who do not work • “Strongly Disagree” • 0% of those using a computer at work • 1.8% of those not using a computer at work • 11.5% of those who do not work
Preliminary CATI Survey Results (continued) • Email is a good way to contact officials • “Strongly Agree” • 19.5% of those with a home computer • 10.8% of those without a home computer • “Strongly Disagree” • 1.2% of those with a home computer • 3.3% of those without a home computer
Preliminary CATI Survey Results (continued) • Computers should be made available to the general public • “Strongly Agree” • 48.7% of those using a computer at work • 31.9% of those not using a computer at work • 38.9% of those who do not work • “Strongly Disagree” • 0.4% of those using a computer at work • 0% of those not using a computer at work • 0% of those who do not work
Preliminary CATI Survey Results (continued) • Computers should be made available to the general public • “Strongly Agree” • 47.5% of those with a home computer • 24.6% of those without a home computer • “Strongly Disagree” • 0.3% of those with a home computer • 0% of those without a home computer
Preliminary CATI Survey Results (continued) • Elections should be held on the Internet • “Strongly Agree” • 5.3% of those using a computer at work • 1.1% of those not using a computer at work • 3.8% of those who do not work • “Strongly Disagree” • 19.7% of those using a computer at work • 20.7% of those not using a computer at work • 32.1% of those who do not work