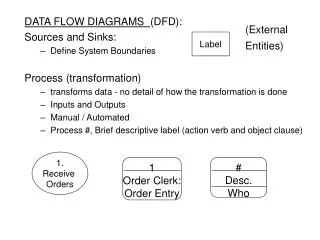
Download
1 / 63
630 likes | 772 Vues
This research presents a comprehensive analysis of dust dynamics across North Africa, focusing on historical data from 1980 to 2000. Utilizing various datasets including surface-based synops from GCOS, local meteorological agencies, and TOMS AI data, the study examines seasonal visibility, trajectory modeling, and regional transport corridors. It also assesses the correlation between dust events and climate variables, revealing insights into interannual variability, recirculation patterns, and potential sand flux influences. Findings inform climate impact assessments and dust management strategies.

E N D
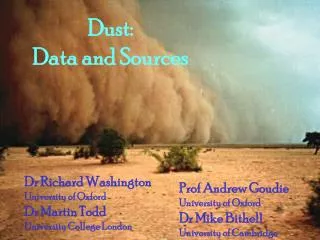
Dust: Data and Sources Dr Richard Washington University of Oxford Dr Martin Todd University College London Prof Andrew Goudie University of Oxford Dr Mike Bithell University of Cambridge
Outline • Dust Data • Surface based synops (from GCOS, 117 stations, 3hrly 1980-2000) • Surface based synops (from local Met Agencies) • TOMS AI data • IDDI • Shuttle Photographs, NOAA images etc • Climate Data and Trajectory modelling • Reanalysis Data (NCEP and ERA-15) 3D winds • 25 point forward trajectory clusters • every 6 hours for 10days, 1979-1998 • Determine regional transport corridors • Re-circulation • Interannual variability
Outline • Dust Data • Surface based synops (from GCOS, 117 stations) • Surface based synops (from local Met Agencies) Niger, Chad, Algeria, Mali, Mari • TOMS AI data • IDDI • Shuttle Photographs, NOAA images etc • Climate Data and Trajectory modelling • Reanalysis Data (NCEP and ERA-15) 3D winds • 25 point forward trajectory clusters • every 6 hours for 10days, 1979-1998 • Determine regional transport corridors • Re-circulation
N’Djamena, Chad: Haze Vs Obs Rainfall By season
Bilma, Niger: sandstorms Vs TOMS by season
North African Surface Dust storms Correlation TOMS 1980-2000
Outline • Dust Data • Surface based synops (from GCOS, 117 stations) • Surface based synops (from local Met Agencies) Niger, Chad, Algeria, Mali, Mari • TOMS AI data • IDDI • Shuttle Photographs, NOAA images etc • Climate Data and Trajectory modelling • Reanalysis Data (NCEP and ERA-15) 3D winds • 25 point forward trajectory clusters • every 6 hours for 10days, 1979-1998 • Determine regional transport corridors • Re-circulation
REOF2 of TOMS AI monthly anomalies for the period 1980-05/93 and 1997-2000
REOF3 of TOMS AI monthly anomalies for the period 1980-05/93 and 1997-2000
REOF5 of TOMS AI monthly anomalies for the period 1980-05/93 and 1997-2000
REOF6 of TOMS AI monthly anomalies for the period 1980-05/93 and 1997-2000
REOF7 of TOMS AI monthly anomalies for the period 1980-05/93 and 1997-2000
REOF8 of TOMS AI monthly anomalies for the period 1980-05/93 and 1997-2000
Apr Potential Sand Flux overlay TOMS q = 2.61 U3*pg –1 (1-U*/U*)(1+U*/U*)2
SahelTOMS (white contours), potential sand flux (black contours), with DEM (colour). LTM for JFM 80-00.
Central AsiaTOMS (white contours), potential sand flux (black contours), with DEM (colour). Long term mean for 80-00.
Correlation of monthly visibility anomalies at Nouakchott (Mauritania) with global NCEP derived potential sand flux for 1980-2000
Correlation of monthly visibility anomalies at Bobo-Dioulasso (Burkina Faso) with global NCEP derived potential sand flux for 1980-2000
Outline • Dust Data • Surface based synops (from GCOS, 117 stations) • Surface based synops (from local Met Agencies) Niger, Chad, Algeria, Mali, Mari • TOMS AI data • IDDI • Shuttle Photographs, NOAA images etc • Climate Data and Trajectory modelling • Reanalysis Data (NCEP and ERA-15) 3D winds • 25 point forward trajectory clusters • every 6 hours for 10days, 1979-1998 • Determine regional transport corridors • Re-circulation
Djouf region Bodele
Parcel trajectory climatology May (1979-98) Bodele depression (17.5N, 17E) 54% of trajectories cross the 15W meridian 27% of trajectories remain over N. Africa 21% of trajectories remain over Sahara (> 15N)
Parcel trajectory climatology June (1979-98) Bodele depression (17.5N, 17E) 79% of trajectories cross the 15W meridian 13% of trajectories remain over N Africa 9% of trajectories remain over Sahara (> 15N)
Parcel trajectory climatology Dec (1979-98) Bodele depression (17.5N, 17E) 66% of trajectories cross the 15W meridian 23% of trajectories remain over N. Africa 6% of trajectories remain over Sahara (> 15N)
Dust Recycling potential May July June Dec
Parcel trajectory climatology May (1979-98) Bodele depression (17.5N, 17E) Mean 0-15N
Parcel trajectory climatology Dec (1979-98) Bodele depression (17.5N, 17E) Mean 0-15N
TOMS AI over Bodele region (15-17N, 16-18E) mean May 1991 May 1989
May 1991 Height (hPa) Lat. Long.
May 1989 Height (hPa) Lat. Long.