Test Case Design Methodologies (Black-box methods)
Test Case Design Methodologies (Black-box methods). P. Pavankumar, CSTE Moderator, cste_mumbai@yahoo.com http://www.geekswithblogs.net/ppothuraju/ ppothu@yahoo.com. Agenda. Black-box testing Test Case – principles Test Case Design Equivalence Partitioning Boundary Value Analysis

Test Case Design Methodologies (Black-box methods)
E N D
Presentation Transcript
Test Case Design Methodologies(Black-box methods) P. Pavankumar, CSTE Moderator, cste_mumbai@yahoo.com http://www.geekswithblogs.net/ppothuraju/ ppothu@yahoo.com
Agenda • Black-box testing • Test Case – principles • Test Case Design • Equivalence Partitioning • Boundary Value Analysis • Cause – Effect Graph • Error Guessing
Black-box testing • In a Black-box testing the tester is completely unconcerned about the internal behaviour and structureof the program (tester views the program as a black box). • The tester is only interested in finding circumstances in which the program does not behave according to its specifications. • Test data are derived solely from the specifications. • Black-box testing strategy is also called as data-drivenor input/output-driven testing.
Black-box testing • To find all the errors in the program the criterion is exhaustive input testing. • Exhaustive input testing is the use of every possible input condition as a test case. • Exhaustive testing is next to impossible and therefore a test of any program must be necessarily incomplete (i.e. the testing cannot guarantee the absence of all errors). • The obvious strategy then is to try to reduce this incompleteness as much as possible.
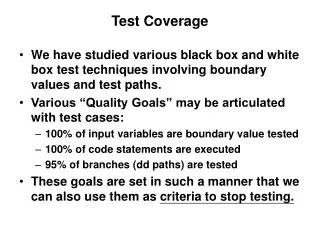
Test Case – principles* • A good test case is one that has a high probability of detecting an as-yet undiscovered error. • A successful test case is one that detects an as-yet undiscovered error. • A necessary part of the test case is a definition of the expected output or result • Test cases must be written for invalid and unexpected, as well as valid and expected input conditions * Courtesy: The Art of Software Testing - Myers
Test Case Design • The most important consideration in software testing is the design or invention of effective test cases. • The reason for the importance of test-case design stems from the fact that “complete” testing is impossible. • Given constraints on time, cost etc., the key issue of testing becomes What subset of all possible test cases has the highest probability of detecting the most errors? • The study of test-case-design methodologies supplies reasonable answers to the above question.
Equivalence Partitioning Equivalence Partitioning is a black-box design method where test cases are developed by partition the input domain of a program into a finite number of equivalence classes such that one can reasonably assume (but, of course, not be absolutely sure) that test of a representative value of each class is equivalentto a test of any other value. • That is, if onetest case in an equivalence class detects an error, all other test cases in the equivalence class would be expected to find the same error. • Conversely, if the test case did not detect an error, we would expect that no other test case in the equivalence class would find an error (unless a subset of the equivalence class falls within any other equivalence class, since equivalence classes may overlap one another).
Input domain partitioned into four sub-domains. Input domain 2 1 3 4 Equivalence Partitioning Four test inputs, one selected from each sub-domain. Too many test inputs.
How to partition? • Inputs to a program provide clues to partitioning. • Example 1: • Suppose that program P takes an integer X as input. • For X< 0 the program is required to perform task T1 and for X>=0 task T2.
How to partition? (contd.) • The input domain is prohibitively large because X can assume a large number of values. • However, we expect P to behave the same way for all X<0. • Similarly, we expect P to perform the same way for all values of X>=0. • We therefore partition the input domain of P into two sub-domains.
One test case: X=-3 Equivalence class X<0 X>=0 Equivalence class Another test case: X=15 Two sub-domains All test inputs in the X<0 sub-domain are considered equivalent (there behaviour is same i.e. they are less than X). The assumption is that if one test input in this sub-domain reveals an error in the program, so will the others. This is true of the test inputs in the X>=0 sub-domain also.
Non-overlapping Partitions • In the previous example, the two equivalence classes arenon-overlapping. In other words the two sub-domains aredisjoint. • When the sub-domains aredisjoint, it is sufficient to pick one test input from each equivalence class to test the program.
Non-overlapping Partitions • An equivalence class is considered coveredwhen at least one test has been selected from it. • In partition testing our goal is to cover all equivalence classes.
Overlapping Partitions • Example 2: • Suppose that program P takes three integers X, Y and Z. It is known that: • X < Y • Z > Y
X<Y, Z<=Y X=2, Y=3, Z=1 X>=Y, Z<=Y X=15, Y=4, Z=1 X<Y X<Y, Z>Y X=3, Y=4, Z=7 X>=Y Z>Y Z<=Y X>=Y, Z>Y X=15, Y=4, Z=7 Overlapping Partitions
Overlapping Partitions – Test Selection • In this example, we could select 4 test cases as: • X=4, Y=7, Z=1 satisfies X<Y • X=4, Y=2, Z=1 satisfies X>=Y • X=1, Y=7, Z=9 satisfies Z>Y • X=1, Y=7, Z=2 satisfies Z<=Y • Thus, we have one test case from each equivalence class.
Overlapping Partitions – Test Selection • However, we may also select only 2 test inputs and satisfy all four equivalence classes: • X=4, Y=7, Z=1 satisfies X<Y and Z<=Y • X=4, Y=2, Z=3 satisfies X>=Y and Z>Y • Thus, we have reduced the number of test cases from 4 to 2 while covering each equivalence class.
Partitioning using non-numeric data • In the previous two examples the inputs were integers. One can derive equivalence classes for other types of data also. • Example 3: • Suppose that program P takes one character X and one string Y as inputs. P performs task T1 for all lower case characters and T2 for upper case characters. Also, it performs task T3 for the null string and T4 for all other strings.
X: lc, Y: not null X: UC, Y: not null X: lc X:UC X: lc, Y: null Y: not null Y: null X: UC, Y: null Partitioning using non-numeric data lc: Lower case character UC: Upper case character null: null string.
Non-numeric Data • Once again we have overlapping partitions. • We can select only 2 test inputs to cover all four equivalence classes. • These are: • X: lower case, Y: null string • X: upper case, Y: not a null string
Guidelines to Equivalence Partitioning • Input condition specifies a range: create one for the valid case and two for the invalid cases. • e.g. for a<=X<=b the classes are • a<=X<=b (valid case) • X<a and X>b (the invalid cases)
Guidelines (contd..) • Input condition specifies a value:create one for the valid value and two for incorrect values (below and above the valid value). e.g. (“select minimum of one and maximum of 6 employees from the list of employees”) -- identify one valid equivalence class and -- two invalid equivalence classes (no employees and more than 6 employees) This may not be possible for certain data types, e.g. for Boolean (yes / no).
Guidelines (contd..) • Input condition specifies a member of a set: create one for the valid value and one for the invalid (not in the set) value. e.g. type of the programming languages must be C++, Java, Perl, -- Identify a valid equivalence class for each and -- One invalid equivalence class (e.g. C#)
Equivalence Partitioning - Facts • Equivalence Partitioning is vastly superior to a random selection of test cases. • It uses the fewest test cases possible to cover the most input requirements. • Although some guidelines are given to assist in the identification of equivalence classes, doing so is mostly an intuitive process. • It overlooks certain types of high yield test cases that boundary-value analysis can determine.
Boundary-value Analysis Boundary Analysis is black-box technique that consists of developing test cases and data that focus on the input and output boundaries of a given function. • Experience shows that test cases that explore boundaryconditionshave a higher payoff than test cases that do not. • Boundary conditions are those situations directly on, above and beneath the edges of input equivalence classes and output equivalence classes.
Boundary-value Analysis Boundary-value analysis differs from equivalence portioning in two respects • Rather than selecting any element in an equivalence class as being representative, boundary-value analysis requires that one or more elements be selected such that each edge of the equivalence class is the subject to a test. • Rather than just focusing attention on the input conditions (input space), test cases are also derived by considering the result space (i.e. output equivalence classes).
Guidelines - Boundary-value Analysis • If an input condition specifies a range of values, write test cases for the ends of the range, and invalid input test cases for situation just beyond the ends. • For instance if the valid domain of an input value is -1.0 and +1.0 write test cases fro the situations -1.0, 1.0, -1.001 and 1.001
Guidelines - Boundary-value Analysis • If and input condition specifies a number of values, write test cases for the minimum and maximum number of values and one beneath and beyond these values. • For instance if an input file can contain 1-255 records, write test cases for 0,1,255, and 256 records.
Guidelines - Boundary-value Analysis • Use guideline 1 for eachoutput condition. • For instance, if a program computes the monthly tax deduction and if the minimum is rs.0.00 and the maximum is rs.1000 write test cases that cause rs.0.00 and rs.1000 to be deducted. • Also, see if it is possible to invent test cases that might cause a negative deduction or a deduction more rs.1000
Guidelines - Boundary-value Analysis • Use guideline 2 for each output condition. • For instance, if an information retrieval system displays the most-relevant abstracts based on the input request, but never more than four abstracts, • write test cases such that the program displays zero, one and four abstracts • write a test case that might cause the program to erroneously display five abstracts.
Boundary-value Analysis - example For example, a program which edits credit limits within a given range (10000 – 15,000) would have • three equivalence classes: • Less than 10,000 (invalid) • Between 10,000 and 15,000 (valid) • Greater than 15,000 (invalid) • In same credit limit example, • boundary analysis would test: • Low boundary plus or minus one (9,999 and 10,001) • On the boundary (10,000 and 15,000) • Upper boundary plus or minus one (14,999 and 15,001)
Boundary-value Analysis - Facts • Boundary-value compliments Equivalence Partitioning • The technique on the surface sounds simple, but boundary conditions may be very subtle and hence identification of them requires a lot of thought. • One weakness of Boundary-value analysis and Equivalence Partitioning is that they do not explore combinations of input circumstances.
Cause-Effect Graphing • Cause Effect Graphing is a systematic method of generating test cases representing combinations of conditions. • The graph is actually a digital logic circuit (a combination logic network), but rather than using standard electronics notation, a somewhat simpler notation is used. • No knowledge of electronics is necessary other than an understanding of Boolean logic (i.e. understating the logic operators and, or, and not)
Cause-Effect Graphing • A CAUSE may be thought of as a distinct input condition, or an ‘‘equivalence class’’ of input conditions. • An EFFECT may be thought of as a distinct output condition, or a meaningful change in program state. • Causes and Effects are represented as Boolean variables and the logical relationships among them CAN (but need not) be represented as one or more Boolean graphs.
Cause-Effect Graphing • Basic cause-effect graph symbols NOT IDENTITY a b a b AND a OR a C d b b C
Cause-Effect Graphing • Process to derive test cases • The specification is divided into “workable” pieces. • The CAUSES and EFFECTS in the specification are identified. • Causes and Effects are identified by reading the specification word by word and underlining words or phases that describe causes and effects. • Each cause and effect is assigned a unique number.
Cause-Effect Graphing • Process to derive test cases • The semantic content of the specification is analyzed and transformed into a Boolean graph linking the causes and effects. This is the cause-effect graph. • The graph is annotated with constraints describing combinations of cause and/or effects that are impossible because of syntactic or environmental constraints. • By methodically tracing state conditions in the graph the graph is converted into a limited-entry decision table. Each column in the table represents a test case. • The columns in the decision table are converted into test cases.
Cause-Effect Graphing - Example • The character in column 1 must be an “A” or a “B”. The character in column 2 must be digit. In this situation the file update is made. If the first character is incorrect, message X12 is issued. If the second character is not a digit, message X13 is issued. • The causes are: • 1 – character in column 1 is “A” • 2 - character in column 1 is “B” • 3 - character in column 2 is a digit • And the effects are: • 70 – update made • 71 – message X12 is issued • 72 – message X13 is issued
Cause-Effect Graphing • Cause-Effect graph of the example • Notice the intermediate node 11 that was created. • The graph represents the specification by setting all possible states of the causes and seeing that the effects are set to the correct values. Do achieve this we create dummy nodes like 11. 70 1 11 71 2 72 3
Cause-Effect Graphing • Cause-Effect graph of the example • Notice the intermediate node 11 that was created. • The graph represents the specification by setting all possible states of the causes and seeing that the effects are set to the correct values. Do achieve this we create dummy nodes like 11. 70 1 11 71 2 72 3
Cause-Effect Graphing • Cause-Effect graph - apply the constraints • In most programs, certain combinations of causes are impossible because of syntactic or environmental considerations (e.g. a character cannot be an “A” and a “B” simultaneously). To account such scenarios we use constraints • Exclusive Constraints (at most one of ‘a’ and ‘b’ can be 1) • Inclusive Constraint (at least one of ‘a’, ‘b’, and ‘c’ must always be 1) • One and Only One (one and only one of ‘a’ and ‘b’ must be 1) • Requires (for ‘a’ to be 1, ‘b’ must be 1) • Masks (constraint among effects – if effect ‘a’ is 1, effect ‘b’ is forced to 0)
Cause-Effect Graphing • Cause-Effect graph - apply the constraints • Constraints Symbols a Exclusive a Inclusive E b b I C
Cause-Effect Graphing • Cause-Effect graph after applying Exclusive constraints 70 1 E 11 71 2 72 3
Cause-Effect Graphing • Cause-Effect graph after applying Exclusive constraints 70 1 E 11 71 2 72 3
Cause-Effect Graphing - Example Designing a Decision Table from the Cause-Effect Graph
Cause-Effect Graphing • Designing a Decision Table from the Cause-Effect Graph 70 ≠ A A 1 ≠ B E 11 B 71 2 Di ≠ Di 72 3
Cause-Effect Graphing - Example Designing a Decision Table from the Cause-Effect Graph Possible Values
Cause-Effect Graphing - Example Designing a Decision Table from the Cause-Effect Graph Applying Relationships / Combinations
Cause-Effect Graphing - Example Designing a Decision Table from the Cause-Effect Graph Applying Relationships / Combinations
Cause-Effect Graphing - Example Designing a Decision Table from the Cause-Effect Graph Applying Relationships / Combinations