Download
1 / 48
480 likes | 667 Vues
AY202a Galaxies & Dynamics Lecture 16: Galaxy Groups & Clusters. Galaxies Are Not Randomly Distributed in Space. Fundamental discovery (and debate) in the 20th century is that Galaxies cluster. On small scales: Binaries ~100 kpc

E N D
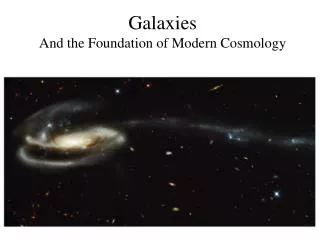
AY202a Galaxies & DynamicsLecture 16:Galaxy Groups & Clusters
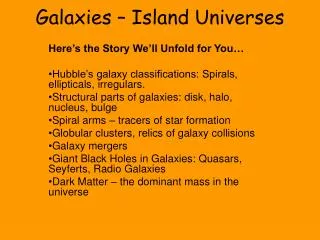
Galaxies Are Not Randomly Distributed in Space Fundamental discovery (and debate) in the 20th century is that Galaxies cluster. On small scales: Binaries ~100 kpc intermediate scales: Groups ~1 Mpc larger scales: Clusters few Mpc even larger scales: Superclusters 10’s Mpc largest seen: Voids + Cosmic Web ~50 Mpc
Messier’s map: What do you see?
History Clustering of nebulae known since the first maps. 1930’s Hubble declares that the universe is “Sensibly Uniform” -- i.e. clusters rare Zwicky studies clusters and finds them common with clustering occurring on all scales Shapley describes a supercluster 1948 Palomar Schmidt telescope goes into operation to produce the National Geographic Palomar Observatory Sky Survey (POSS) 1956 George Abell produces first catalog of clusters
Abell Catalog 2712 Clusters discovered on the POSS plates > -30o mostly high |b| Abell defined a size, RA = 1.72’/z Abell Radius ~ 1.5 h-1 Mpc (~ 2.1 Mpc for H0= 70) Richness defined in terms of the number of galaxies within m3 to m3 + 2 0 = 30-49 3 = 130-199 68 clusters in AC 1 = 50-79 4 = 200-299 6 clusters 2 = 80-129 5 = 300+ 1 cluster Abell’s original estimate of the cluster space density was 10-5 /Mpc3 What is SD with today’s surveys?
Distance classes based on tenth brightest galaxy magnitude: 1: mag 13.3-14.0 <z> ~ 0.028 2: mag 14.1-14.8 ~ 0.040 3: mag 14.9-15.6 ~ 0.058 Why the 10th brighest? 4: mag 15.7-16.4 ~ 0.079 5: mag 16.5-17.2 ~ 0.131 6: mag 17.3-18.0 ~ 0.198 Eventually Abell, Corwin & Olowin (1989) added the rest of the sky from the southern (SRC) Schmidt at Coonabarabran. ACO catalog now 4076 clusters total, all sky. Many other cluster catalogs Zwicky + 10,000 clusters, northern sky Sersic, Duus & Newell, Noonan, Dressler, APM survey, SDSS in optical X-ray: Piccinotti 35 Clusters HEAO A (1978), now ROSAT surveys also identified via Radio Sources (3C clusteers, etc) + some deep surveys
Magnitude-Redshift for Abell (Postman et al. ’85) Scott effect? M10 correlates with richness Richness correlates with distance (how?)
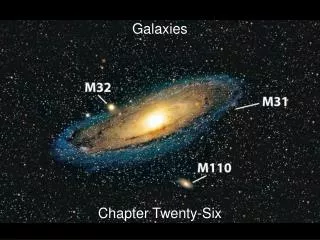
Galaxy Groups The Local Group first identified by Lundmark, Hubble & friends 2 Big galaxies (M31 + MW), 5 or 6 mid-sized galaxies (M33, LMC,SMC, M32, IC1613, NGC6822, and dwarf Companions.
30 Doradus LMC
IC10 NGC6822 Fornax Dwarf IC1613 0.5 degree
Mass of the LG Kahn & Woltjer’s timing argument (1952) v (M31-MW) = -118 km/s has solutions of the form r = Rmax/2 (1 – cos ) for = 0 to t = ( )1/2 ( - sin ) d2r - GMtotal dt2 r2 = and assume r=0 at t=0 Rmax3 8GMtotal
dr dr dt 2GMtotal sin dt d d Rmax (1 - cos ) r increases from 0 to Rmax and then decreases as cycles. Relative velocity is v = = / = ( )1/2 ( ) combine to give and assuming t = 14 Gyr, r = 770 kpc, we can solved for , and then the mass of the Local Group. v t sin ( - sin ) r (1 – cos )2 =
Other Galaxy Groups Many other galaxy groups identified on the sky and in initial surveys --- nearest M81, Sculptor, Centaurus, etc. and eventually many nearby clusters (Virgo, Fornax, Centaurus, Pegasus, Perseus, etc. --- note that many of these are not in Abell’s catalog! Why?) First systematic group catalog goes to deVaucouleurs (1975) who identified galaxy groups “by eye” on the sky by associating galaxies by morphology, position and a few redshifts
DeVaucouleurs’ galaxy group list from Vol. IX of Stars and Stellar Systems.
The Local Neighborhood (Tully)
Hickson Compact Groups (1978)
HCG 62 in x-rays HCG 87 optical
3-D Groups First real attempt to get a large homogeneous set of galaxy groups in 3-D by Huchra & Geller (1982, 1983) who derived the redshift-space Percolation algorithm a.k.a. Friends-of-Friends To correct for the redshift dependent selection function, define limits such that D < Dfiducial[ φ(L) dL/ φ(L) dL] Where Mlim = mlim -25 -5 log (Vfiducial /H0) and Mpair = mlim -25 -5 log ((V1 + V2) /2H0) Mpair Mlim -∞ -∞
And V = |V1 - V2| < Vlim(V1,V2,m1,m2) with two choices, either fix V or scale it as D. Then select Dlim and Vlim as needed for the sample you have. RSA Sample
Hhhhh kkkkkkkkkkk “Groupy” Flow Chart Start with any galaxy and look for friends, then look around friends for more until you don’t find any more. Then go to the next unsearched galaxy and start over….
Different Dlim ‘s correspond to different density enhancements relative to the mean number density of galaxies in the sample. You can also ask if the crossing times are reasonable tv = 3/53/2 rH/ Virial crossing time. What should it be?
Density contours around Virgo: 2 = dash dot 20 = dash 100 = solid HG ‘82
Other checks Other checks vs z CfA groups GH ‘83
Most recent large group catalogs: Eke et al. 2004; Padilla et al. 2004 2PIGGs = 2dF Percolation Inferred Galaxy Group Survey clustering of group, bias factor Crook et al. 2007 2MRS Survey group masses, M/L,
2dF 2PIGS
2MRS Group Selection Number of groups found f
/ =12 80 3 largest 2MRS Groups Virgo, Fornax/Eridanus, Perseus-Pisces
2MASS Galaxy Groups δρ/ρ = 12 δρ/ρ = 80 ------------------------------------------------------- σP (km/s) 197 183 RPV (Mpc) 1.71 0.97 log MV/LK 1.70 1.53 Log MP/LK 1.90 1.67 ΩM,V 0.14+/-0.02 0.10+/-0.02 ΩM,P 0.23+/-0.03 0.13+/-0.02 -------------------------------------------------------- V=Virial Estimator P = Projected Mass