libperf
LightSpeed : Task Scheduling for Many-Core. Data Graph. Update Functions. Scheduling. Karl Naden ( kbn@cs.cmu.edu ) Wolfgang Richter ( wolf@cs.cmu.edu ) Ekaterina Taralova ( etaralova@cs.cmu.edu ). Introduction

libperf
E N D
Presentation Transcript
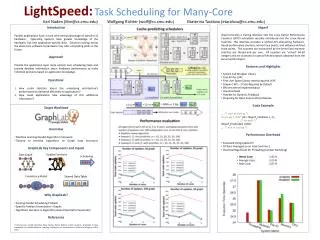
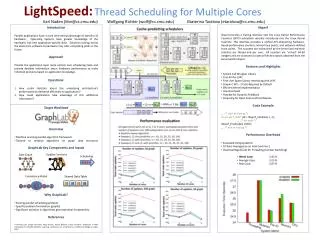
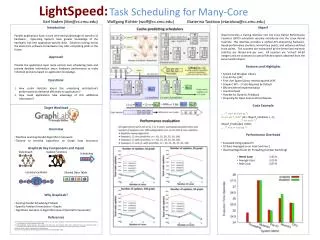
LightSpeed:Task Scheduling for Many-Core Data Graph Update Functions Scheduling Karl Naden (kbn@cs.cmu.edu) Wolfgang Richter (wolf@cs.cmu.edu) Ekaterina Taralova (etaralova@cs.cmu.edu) Introduction Parallel applications have a hard time taking advantage of specifics of hardware. Operating Systems have greater knowledge of the hardware, but lose application-specific data. Solutions cutting across the stack from software to hardware may offer compelling paths in the future. Approach Provide the application layer more control over scheduling tasks and provide detailed information about hardware performance to make informed decisions based on application knowledge. Questions: How could statistics about the underlying architecture’s performance be delivered efficiently to applications? How could applications take advantage of this additional information? • libperf • libperfprovides a tracing interface into the Linux Kernel Performance Counters (LKPC) subsystem recently introduced into the Linux Kernel mainline. This interface provides a unified API abstracting hardware-based performance counters, kernel trace points, and software-defined trace points. The counters are maintained by the kernel and maintain statistics per thread and per core. All counters are “virtual” 64-bit integers and are accessed via special file descriptors obtained from the kernel within libperf. • Features and Highlights • System Call Wrapper Library • First API for LKPC • First User Space Library Interfacing with LKPC • Simple C API – 2 Calls Required by Default • Efficient Kernel Implementation • Low Overhead • Feasible for Dynamic Feedback • Preparing for Open Source GPLv2 Release • Code Example • … /* start of tracing */ • structperf_data* pd = libperf_initialize(-1,-1); • … /* do work */ • libperf_finalize(pd, UUID); • … /* end of tracing */ • Performance Overhead • Evaluated Using sysbench • 10 Runs Averaged on an Intel Centrino 2 • Overhead Significant for Threading (Context Switching) • Worst Case: 3.63 % • Average Case: 3.25 % • Best Case: 2.87 % Consistency Model Shared Data Table • Target Workload • Overview • Machine Learning Parallel Algorithm Framework • Tailored to Iterative Algorithms on Graph Data Structures • GraphLab Key Components and Inputs • Why GraphLab? • Existing Parallel Scheduling Problem • Specific Problem Formulation—Graphs • Significant Variation in Algorithms Gives Potential for Generality • References • YuchengLow, Joseph Gonzalez, AapoKyrola, Danny Bickson, Carlos Guestrin. GraphLab: A New Framework for Parallel Machine Learning. Conference on Uncertainty in Artificial Intelligence (UAI), 2010


