Download
1 / 11
110 likes | 181 Vues
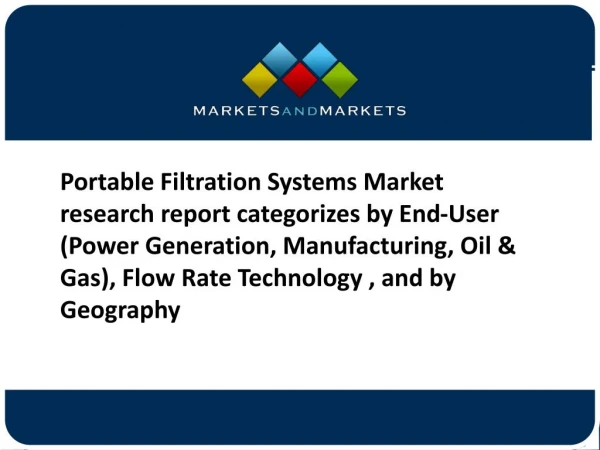
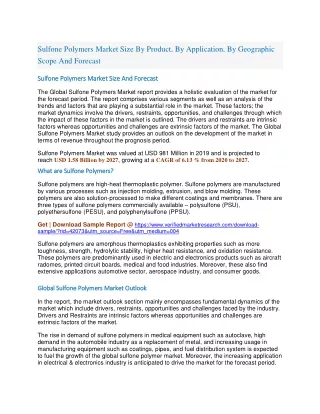
The combination of features such as mechanically tough and rigid, transparent, resistance against hydrolysis and against acidic attacks and melt processing at temperatures of up to 400?C, coupled with ease of fabrication, has enabled sulfone polymers to be used in a wide and increasingly diversified range of applications. Major forces driving the demand for sulfone polymers across the globe include their growing usage in automotive, aerospace, medical and filtration membranes. Replacing metal to reduce weight, reduce emissions and increase fuel efficiency in automotive and aerospace sector is the key driver for future demand for sulfone polymers.

E N D
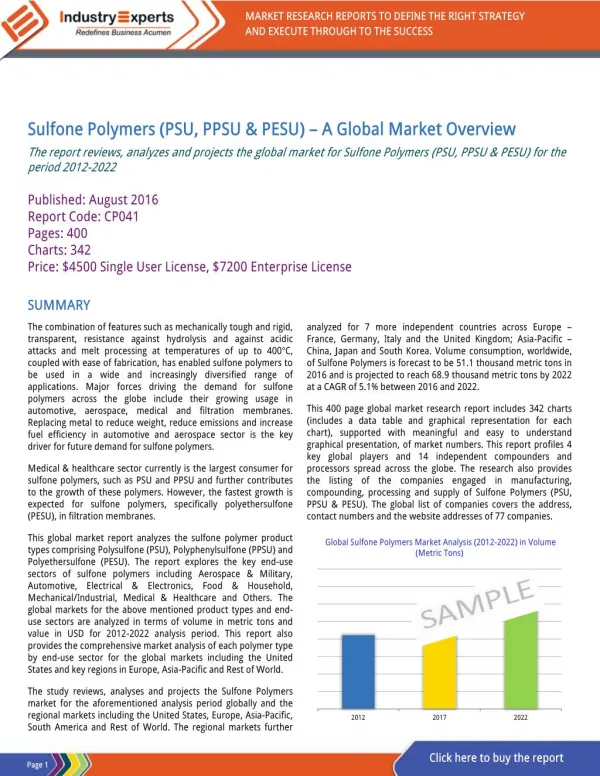
MARKET RESEARCH REPORTS TO DEFINE THE RIGHT STRATEGY AND EXECUTE THROUGH TO THE SUCCESS Sulfone Polymers (PSU, PPSU & PESU) – A Global Market Overview The report reviews, analyzes and projects the global market for Sulfone Polymers (PSU, PPSU & PESU) for the period 2012-2022 Published: August 2016 Report Code: CP041 Pages: 400 Charts: 342 Price: $4500 Single User License, $7200 Enterprise License SUMMARY The combination of features such as mechanically tough and rigid, transparent, resistance against hydrolysis and against acidic attacks and melt processing at temperatures of up to 400°C, coupled with ease of fabrication, has enabled sulfone polymers to be used in a wide and increasingly diversified range of applications. Major forces driving the demand for sulfone polymers across the globe include their growing usage in automotive, aerospace, medical and filtration membranes. Replacing metal to reduce weight, reduce emissions and increase fuel efficiency in automotive and aerospace sector is the key driver for future demand for sulfone polymers. analyzed for 7 more independent countries across Europe – France, Germany, Italy and the United Kingdom; Asia-Pacific – China, Japan and South Korea. Volume consumption, worldwide, of Sulfone Polymers is forecast to be 51.1 thousand metric tons in 2016 and is projected to reach 68.9 thousand metric tons by 2022 at a CAGR of 5.1% between 2016 and 2022. This 400 page global market research report includes 342 charts (includes a data table and graphical representation for each chart), supported with meaningful and easy to understand graphical presentation, of market numbers. This report profiles 4 key global players and 14 independent compounders and processors spread across the globe. The research also provides the listing of the companies engaged in manufacturing, compounding, processing and supply of Sulfone Polymers (PSU, PPSU & PESU). The global list of companies covers the address, contact numbers and the website addresses of 77 companies. Medical & healthcare sector currently is the largest consumer for sulfone polymers, such as PSU and PPSU and further contributes to the growth of these polymers. However, the fastest growth is expected for sulfone polymers, specifically polyethersulfone (PESU), in filtration membranes. This global market report analyzes the sulfone polymer product types comprising Polysulfone (PSU), Polyphenylsulfone (PPSU) and Polyethersulfone (PESU). The report explores the key end-use sectors of sulfone polymers including Aerospace & Military, Automotive, Electrical & Electronics, Food & Household, Mechanical/Industrial, Medical & Healthcare and Others. The global markets for the above mentioned product types and end- use sectors are analyzed in terms of volume in metric tons and value in USD for 2012-2022 analysis period. This report also provides the comprehensive market analysis of each polymer type by end-use sector for the global markets including the United States and key regions in Europe, Asia-Pacific and Rest of World. Global Sulfone Polymers Market Analysis (2012-2022) in Volume (Metric Tons) The study reviews, analyses and projects the Sulfone Polymers market for the aforementioned analysis period globally and the regional markets including the United States, Europe, Asia-Pacific, South America and Rest of World. The regional markets further 2012 2017 2022 Click here to buy the report Page 1
Sulfone Polymers (PSU, PPSU & PESU) – A Global Market Overview August 2016 |400 Pages | 342 Charts | Price $4500 SAMPLE TABLE/CHART SAMPLE COMPANY PROFILE SOLVAY SA (BELGIUM) Rue de Ransbeek, 310 1120 Brussels Belgium Phone: 32 2 2642111 Fax: 32 2 2641484 / 2643061 Website: www.solvay.com Glance at 2017 Global Sulfone Polymers Volume Market Share (%) by Geographic Region – United States, Europe, Asia-Pacific and Rest of World Business Profile Solvay SA, established in 1863 and based in Brussels, Belgium, is a leading global chemicals and plastics company. The company’s range of products and solutions comprises amines, antioxidants and stabilizers, barium and strontium derivatives, calcium and magnesium derivatives, chlorine and derivatives, flavors and fragrances, fluorine derivatives, lithium derivatives, peroxygens, phenols and derivatives, phosphorus derivatives, polymers, rare earths and metal compounds, silicium derivatives, sodium derivatives, solvents, specialty chemicals, surfactants and wood derivatives. Solvay supplies its products to a variety of industries, including aerospace, alternative energy, automotive, chemical, construction, consumer goods, food and beverage and oil and gas. Asia-Pacific Sulfone Polymers Market Analysis (2012-2022) by End-Use Sector – Aerospace & Military, Automotive, Building & Construction, Electrical & Electronics, Food & Household, Mechanical/Industrial, Medical & Healthcare and Others in Metric Tons specialty polymers, Solvay’s array of specialty polymers includes more than 35 product lines available in more than 1500 formulations. The company’s high performance polymers offerings include the following: Polymer Category Particulars 2012 2017 2022 Fluoropolymers Algoflon® L/Polymist® PTFE Micronized Powders, Algoflon® PTFE Dispersions, Algoflon® PTFE Fine Coagulated Powders, Algoflon® PTFE Granulars, Halar® ECTFE, Halar® ECTFE for Coatings, Hyflon® PFA & MFA® , Hyflon® PFA & MFA® for Coatings, Hylar® 5000 PVDF for Architectural Coatings, Hylar® PVDF for Coatings, Solef® PVDF, Fluorolink® PFPE and Fomblin® PFPE Functional KEY PLAYERS PROFILED •BASF SE •Jiangmen Youju New Materials Co., Ltd •Solvay SA oSolvay Specialty Polymers USA, LLC •Sumitomo Chemical Company, Limited Aromatic Polyamides Amodel® polyphthalamide (PPA), Ixef® polyarylamide (PARA), Kalix® high-performance polyamides (HPPA), High-Performance Polyesters and Lavanta® HPP (high-performance polyesters) Aromatic Polyketones AvaSpire® PAEK (polyaryletherketone), Torlon® PAI (polyamide- imide) and KetaSpire® PEEK (polyetheretherketone) Sulfone Polymers Acudel® modified polyphenylsulfone (PPSU), EpiSpire® high- temperature sulfone (HTS), Radel® polyphenylsulfone (PPSU), Udel® polysulfone (PSU) and Veradel® polyethersulfone (PESU) REGIONS COVERED •United States •Europe(France, Germany, Italy, The United Kingdom and other countries) •Asia-Pacific(China, Japan, India, South Korea and Rest of Asia-Pacific) •Rest of World Liquid Crystal Polymer Xydar® LCP Polyamide-Imide Torlon® PAI Self-Reinforced Polyphenylene PrimoSpire® SRP Polyphenylene Sulfide Ryton® PPS …………………….more …………………….more Click here to buy the report Page 2
Sulfone Polymers (PSU, PPSU & PESU) – A Global Market Overview August 2016 |400 Pages | 342 Charts | Price $4500 TABLE OF CONTENTS Chart 15: Global Sulfone Polymers Neat Resin Installed Capacity by Manufacturer and Country in Metric Tons ... 38 4. GLOBAL MARKET OVERVIEW ............................. 69 Chart 16: Global Sulfone Polymers Market Analysis (2012- 2022) in Volume (Metric Tons) and Value (USD Million) . 69 4.1 Global Sulfone Polymers Market Overview by End- Use Sector ............................................................... 70 Volume Analysis ...................................................... 70 Chart 17: Global Sulfone Polymers Market Analysis (2012- 2022) by End-Use Sector – Aerospace & Military, Automotive, Building & Construction, Electrical & Electronics, Food & Household, Mechanical/Industrial, Medical & Healthcare and Others in Metric Tons ........... 70 Chart 18: Glance at 2012, 2017 and 2022 Global Sulfone Polymers Volume Market Share (%) by End-Use Sector – Aerospace & Military, Automotive, Building & Construction, Electrical & Electronics, Food & Household, Mechanical/Industrial, Medical & Healthcare and Others . 71 Value Analysis .......................................................... 72 Chart 19: Global Sulfone Polymers Market Analysis (2012- 2022) by End-Use Sector – Aerospace & Military, Automotive, Building & Construction, Electrical & Electronics, Food & Household, Mechanical/Industrial, Medical & Healthcare and Others in USD Million ........... 72 Chart 20: Glance at 2012, 2017 and 2022 Global Sulfone Polymers Value Market Share (%) by End-Use Sector – Aerospace & Military, Automotive, Building & Construction, Electrical & Electronics, Food & Household, Mechanical/Industrial, Medical & Healthcare and Others . 73 4.1.1 Sulfone Polymers End-Use Sector Market Overview by Global Region ...................................... 74 4.1.1.1 Aerospace & Military ................................... 74 Volume Analysis ...................................................... 74 Chart 21: Global Market for Sulfone Polymers in Aerospace & Military Sector (2012-2022) by Geographic Region – United States, Europe, Asia-Pacific and Rest of World in Metric Tons ...................................................... 74 Chart 22: Glance at 2012, 2017 and 2022 Global Sulfone Polymers Volume Market Share (%) in Aerospace & Military Sector by Geographic Region – United States, Europe, Asia-Pacific and Rest of World ........................... 75 Value Analysis .......................................................... 76 Chart 23: Global Market for Sulfone Polymers in Aerospace & Military Sector (2012-2022) by Geographic Region – United States, Europe, Asia-Pacific and Rest of World in USD Million ...................................................... 76 Chart 24: Glance at 2012, 2017 and 2022 Global Sulfone Polymers Value Market Share (%) in Aerospace & Military Sector by Geographic Region – United States, Europe, Asia-Pacific and Rest of World ........................................ 77 4.1.1.2 Automotive .................................................. 78 Volume Analysis ...................................................... 78 Chart 25: Global Market for Sulfone Polymers in Automotive Sector (2012-2022) by Geographic Region – United States, Europe, Asia-Pacific and Rest of World in Metric Tons ........... 78 Chart 26: Glance at 2012, 2017 and 2022 Global Sulfone Polymers Volume Market Share (%) in Automotive Sector by Geographic Region – United States, Europe, Asia-Pacific and Rest of World ........................................................... 79 Value Analysis .......................................................... 80 Chart 27: Global Market for Sulfone Polymers in Automotive Sector (2012-2022) by Geographic Region – United States, Europe, Asia-Pacific and Rest of World in USD Million ........... 80 Chart 28: Glance at 2012, 2017 and 2022 Global Sulfone Polymers Value Market Share (%) in Automotive Sector by Geographic Region – United States, Europe, Asia-Pacific and Rest of World ........................................................... 81 4.1.1.3 Building & Construction ............................... 82 Volume Analysis ...................................................... 82 Chart 29: Global Market for Sulfone Polymers in Building & Construction Sector (2012-2022) by Geographic Region – United States, Europe, Asia-Pacific and Rest of World in Metric Tons ... 82 Chart 30: Glance at 2012, 2017 and 2022 Global Sulfone Polymers Volume Market Share (%) in Building & Construction Sector by Geographic Region – United States, Europe, Asia-Pacific and Rest of World ........................... 83 PART A: GLOBAL MARKET PERSPECTIVE ........ 1 1. INTRODUCTION .................................................. 1 Chart 1: Global Sulfone Polymers Market 2012, 2016 and 2022 ................................................................................. 1 Chart 2: Global Sulfone Polymers Market (2016 and 2022) by Geographic Region ...................................................... 2 Chart 3: Global Sulfone Polymers Market (2016 and 2022) by Polymer Type ............................................................... 3 1.1 Product Outline ................................................ 4 1.1.1 Sulfone Polymers .............................................. 4 1.1.1.1 Polysulfone (PSU) ........................................... 5 1.1.1.1.1 Properties of PSU ........................................ 5 1.1.1.1.2 PSU Strengths and Limitations .................... 7 1.1.1.1.3 Polysulfone (PSU) Applications ................... 7 1.1.1.1.4 PSU Processing ............................................ 9 1.1.1.2 Polyethersulfone (PESU) .............................. 10 1.1.1.2.1 Properties of PESU .................................... 10 1.1.1.2.2 PESU Strengths and Limitations ................ 11 1.1.1.2.3 Polyethersulfone (PESU) Applications ....... 12 1.1.1.2.4 PESU Processing ........................................ 14 1.1.1.3 Polyphenylsulfone (PPSU) ............................ 14 1.1.1.3.1 Properties of PPSU .................................... 15 1.1.1.3.2 PPSU Benefits and Limitations .................. 16 1.1.1.3.3 Polyphenylsulfone (PPSU) Applications .... 16 1.1.1.3.4 PPSU Processing ........................................ 17 1.1.1.4 Sulfone Polymers Synthesis ......................... 18 1.1.1.4.1 Nucleophilic Displacement Route ............. 18 1.2 End-Use Sector Analysis – A Global Snapshot .. 22 Chart 4: Global Sulfone Polymers Market Analysis (2012, 2016 & 2020) by End-Use Sector in Metric Tons .............22 1.2.1 Aerospace & Military ...................................... 23 Chart 5: Global Market for Sulfone Polymers in Aerospace & Military Sector (2012, 2016 & 2020) by Geographic Region in Metric Tons ......................................................23 1.2.2 Automotive ..................................................... 24 Chart 6: Global Market for Sulfone Polymers in Automotive Sector (2012, 2016 & 2020) by Geographic Region in Metric Tons ......................................................24 1.2.3 Building & Construction .................................. 25 Chart 7: Global Market for Sulfone Polymers in Building & Construction Sector (2012, 2016 & 2020) by Geographic Region in Metric Tons ......................................................25 1.2.4 Electrical & Electronics .................................... 26 Chart 8: Global Market for Sulfone Polymers in Electrical & Electronics Sector (2012, 2016 & 2020) by Geographic Region in Metric Tons ......................................................26 1.2.5 Food & Household .......................................... 27 Chart 9: Global Market for Sulfone Polymers in Food & Household Sector (2012, 2016 & 2020) by Geographic Region in Metric Tons ......................................................27 1.2.6 Mechanical/Industrial ..................................... 28 Chart 10: Global Market for Sulfone Polymers in Mechanical/Industrial Sector (2012, 2016 & 2020) by Geographic Region in Metric Tons ...................................28 1.2.7 Medical & Healthcare ..................................... 29 Chart 11: Global Market for Sulfone Polymers in Medical & Healthcare Sector (2012, 2016 & 2020) by Geographic Region in Metric Tons ......................................................29 1.2.8 Other Sectors .................................................. 30 Chart 12: Global Market for Sulfone Polymers in Other Sectors (2012, 2016 & 2020) by Geographic Region in Metric Tons ... 30 1.3 Key Market Trends & Growth Drivers .............. 31 2.2 Key Global Players........................................... 39 BASF SE (Germany) ......................................................... 39 Jiangmen Youju New Materials Co., Ltd (China) .............. 41 Solvay SA (Belgium)......................................................... 42 Solvay Specialty Polymers USA, LLC ............................ 44 Sumitomo Chemical Company, Limited (Japan) .............. 45 2.3 Key Independent Compounders and Processors ... 47 Centroplast Engineering Plastics GmbH (Germany) ........ 47 Ensinger Inc. (United States) ........................................... 48 Evonik Industries AG (Germany) ..................................... 49 GEHR GmbH (Germany) .................................................. 50 Infinity LTL Engineered Compounds (United States) ....... 51 Lati Industria Termoplastici S.p.A. (Italy) ......................... 52 Ovation Polymers Inc. (United States)............................. 53 Oxford Polymers, Inc. (United States) ............................. 54 Polymer Industries (United States) ................................. 55 Polyone Corporation (United States) .............................. 56 Quadrant AG (Switzerland) ............................................. 57 RTP Company (United States) ......................................... 58 Sabic Innovative Plastics US LLC (United States) ............. 59 Westlake Plastics Company (United States) .................... 60 3. KEY BUSINESS & PRODUCT TRENDS ................... 61 Sumitomo Chemical to Build Second Polyethersulfone (PESU) Plant in Japan ...................................................... 61 UJU Signed an Exclusive Deal with Conventus to Meet Polysulfone Crisis in North America ................................ 61 Solvay's New Deal with ResMart to Distribute Eight Radel® PPSU Resin Grades .......................................................... 61 Solvay's TegraCore™ PPSU Foam Received Airbus Qualification ................................................................... 62 Toho Tenax Introduces New Polyethersulfone Impregnated Thermoplastic Textile Prepreg ................... 62 New Veradel® HC A-301 PESU for Challenging Healthcare Applications Unveiled by Solvay ...................................... 62 Biorep Technologies Employed Radel® R-5000 PPSU to Enhance its Ricordi Chamber .......................................... 63 Solvay's Veradel® HC A-301 PESU Used as an Alternative for PEI in ASTi's Sensors .................................................. 63 Introduction of Solvay's Pre-Colored Radel® R-7159 Series Resins for Use in Commercial Aircraft Interiors ............... 63 Hankuk Carbon Selected Virantage® PESU Tougheners to Produce Enhanced Thermoset Composite Prepregs ....... 64 Medical Illumination Used Solvay's Medical-Grade Polymers in its New MI-750 LED Lighting System ............ 64 Solvay Signed a New Licensing Deal with RTP Company to Broaden the Supply of its Radel® R-7000 PPSU Resins to Global Aerospace Market ............................................... 65 Morphix Selected Solvay Radel® PPSU Resins to Replace Metals in its Tattoo Needle Grips .................................... 65 Sumitomo Chemical Increases the Capacity of Polyethersulfone (PESU) at its Ehime Plant ..................... 65 Solvay's New Veradel® 3300 SL 30 PESU Launched at the CTI Symposium ............................................................... 65 ELITechGroup Selected Solvay's Radel® PPSU as an Alternative to Transparent PC Resin for Injection Molding Two Redesigned Slide Stainer Carousels ......................... 66 Solvay Named Infinity LTL an Authorized Color Compounder of Amodel® PPA, Udel® PSU and Xydar® LCP Resins .............................................................................. 66 Strong Compatibility exhibited by Radel® PPSU based Instrument Trays with STERIZONE® VP4 Sterilizer ........... 67 Infinity Joined Forces with LTL to Form Infinity LTL Engineered Compounds .................................................. 67 Technical Polymers to Broaden its Thermec™ Product Line .. 67 Inauguration of BASF's Ultrason® Production Facility in South Korea .................................................................... 68 Novel Range of Color Concentrates from Colorant Chromatics for High Performance PSU Applications ....... 68 TenCate and BASF Collaborated on Automotive Thermoplastic Composites .............................................. 68 LTL to Compound Solvay's Radel® PPSU Resin ................ 68 2. INDUSTRY LANDSCAPE ...................................... 37 2.1 Sulfone Polymers Producers and Production Capacities ............................................................. 37 Chart 13: 2015 Global Sulfone Polymers Neat Resin Installed Capacity by Manufacturer in Metric Tons .........37 Chart 14: Global Sulfone Polymers Neat Resin Installed Capacity by Country in Metric Tons .................................38 Click here to buy the report Page 3
Sulfone Polymers (PSU, PPSU & PESU) – A Global Market Overview August 2016 |400 Pages | 342 Charts | Price $4500 Value Analysis .......................................................... 84 Chart 31: Global Market for Sulfone Polymers in Building & Construction Sector (2012-2022) by Geographic Region – United States, Europe, Asia-Pacific and Rest of World in USD Million .....................................................................84 Chart 32: Glance at 2012, 2017 and 2022 Global Sulfone Polymers Value Market Share (%) in Building & Construction Sector by Geographic Region – United States, Europe, Asia-Pacific and Rest of World ............................85 4.1.1.4 Electrical & Electronics ................................. 86 Volume Analysis ....................................................... 86 Chart 33: Global Market for Sulfone Polymers in Electrical & Electronics Sector (2012-2022) by Geographic Region – United States, Europe, Asia-Pacific and Rest of World in Metric Tons .....................................................................86 Chart 34: Glance at 2012, 2017 and 2022 Global Sulfone Polymers Volume Market Share (%) in Electrical & Electronics Sector by Geographic Region – United States, Europe, Asia-Pacific and Rest of World ............................87 Value Analysis .......................................................... 88 Chart 35: Global Market for Sulfone Polymers in Electrical & Electronics Sector (2012-2022) by Geographic Region – United States, Europe, Asia-Pacific and Rest of World in USD Million .....................................................................88 Chart 36: Glance at 2012, 2017 and 2022 Global Sulfone Polymers Value Market Share (%) in Electrical & Electronics Sector by Geographic Region – United States, Europe, Asia-Pacific and Rest of World ............................89 4.1.1.5 Food & Household ....................................... 90 Volume Analysis ....................................................... 90 Chart 37: Global Market for Sulfone Polymers in Food & Household Sector (2012-2022) by Geographic Region – United States, Europe, Asia-Pacific and Rest of World in Metric Tons .....................................................................90 Chart 38: Glance at 2012, 2017 and 2022 Global Sulfone Polymers Volume Market Share (%) in Food & Household Sector by Geographic Region – United States, Europe, Asia-Pacific and Rest of World .........................................91 Value Analysis .......................................................... 92 Chart 39: Global Market for Sulfone Polymers in Food & Household Sector (2012-2022) by Geographic Region – United States, Europe, Asia-Pacific and Rest of World in USD Million .....................................................................92 Chart 40: Glance at 2012, 2017 and 2022 Global Sulfone Polymers Value Market Share (%) in Food & Household Sector by Geographic Region – United States, Europe, Asia-Pacific and Rest of World .........................................93 4.1.1.6 Mechanical/Industrial .................................. 94 Volume Analysis ....................................................... 94 Chart 41: Global Market for Sulfone Polymers in Mechanical/Industrial Sector (2012-2022) by Geographic Region – United States, Europe, Asia-Pacific and Rest of World in Metric Tons .......................................................94 Chart 42: Glance at 2012, 2017 and 2022 Global Sulfone Polymers Volume Market Share (%) in Mechanical/Industrial Sector by Geographic Region – United States, Europe, Asia-Pacific and Rest of World ....95 Value Analysis .......................................................... 96 Chart 43: Global Market for Sulfone Polymers in Mechanical/Industrial Sector (2012-2022) by Geographic Region – United States, Europe, Asia-Pacific and Rest of World in USD Million .......................................................96 Chart 44: Glance at 2012, 2017 and 2022 Global Sulfone Polymers Value Market Share (%) in Mechanical/Industrial Sector by Geographic Region – United States, Europe, Asia-Pacific and Rest of World .........................................97 4.1.1.7 Medical & Healthcare .................................. 98 Volume Analysis ....................................................... 98 Chart 45: Global Market for Sulfone Polymers in Medical & Healthcare Sector (2012-2022) by Geographic Region – United States, Europe, Asia-Pacific and Rest of World in Metric Tons .....................................................................98 Chart 46: Glance at 2012, 2017 and 2022 Global Sulfone Polymers Volume Market Share (%) in Medical & Healthcare Sector by Geographic Region – United States, Europe, Asia-Pacific and Rest of World ............................99 Value Analysis ........................................................ 100 Chart 47: Global Market for Sulfone Polymers in Medical & Healthcare Sector (2012-2022) by Geographic Region – United States, Europe, Asia-Pacific and Rest of World in USD Million ................................................................... 100 Chart 48: Glance at 2012, 2017 and 2022 Global Sulfone Polymers Value Market Share (%) in Medical & Healthcare Sector by Geographic Region – United States, Europe, Asia-Pacific and Rest of World ...................................... 101 4.1.1.8 Other Sectors ............................................. 102 Volume Analysis..................................................... 102 Chart 49: Global Market for Sulfone Polymers in Other Sectors (2012-2022) by Geographic Region – United States, Europe, Asia-Pacific and Rest of World in Metric Tons .............................................................................. 102 Chart 50: Glance at 2012, 2017 and 2022 Global Sulfone Polymers Volume Market Share (%) in Other Sectors by Geographic Region – United States, Europe, Asia-Pacific and Rest of World ......................................................... 103 Value Analysis ........................................................ 104 Chart 51: Global Market for Sulfone Polymers in Other Sectors (2012-2022) by Geographic Region – United States, Europe, Asia-Pacific and Rest of World in USD Million ........................................................................... 104 Chart 52: Glance at 2012, 2017 and 2022 Global Sulfone Polymers Value Market Share (%) in Other Sectors by Geographic Region – United States, Europe, Asia-Pacific and Rest of World ......................................................... 105 4.2 Global Sulfone Polymers Market Overview by Polymer Type ......................................................... 106 Volume Analysis..................................................... 106 Chart 53: Global Sulfone Polymers Market Analysis (2012- 2022) by Polymer Type – Polysulfone (PSU), Polyphenylsulfone (PPSU) and Polyethersulfone (PESU) in Metric Tons ................................................................... 106 Chart 54: Glance at 2012, 2017 and 2022 Global Sulfone Polymers Volume Market Share (%) by Polymer Type – Polysulfone (PSU), Polyphenylsulfone (PPSU) and Polyethersulfone (PESU) ............................................... 107 Value Analysis ........................................................ 108 Chart 55: Global Sulfone Polymers Market Analysis (2012- 2022) by Polymer Type – Polysulfone (PSU), Polyphenylsulfone (PPSU) and Polyethersulfone (PESU) in USD Million ................................................................... 108 Chart 56: Glance at 2012, 2017 and 2022 Global Sulfone Polymers Value Market Share (%) by Polymer Type – Polysulfone (PSU), Polyphenylsulfone (PPSU) and Polyethersulfone (PESU) ............................................... 109 4.2.1 Sulfone Polymers Product Type Market Overview by Global Region .................................... 110 4.2.1.1 Polysulfone (PSU) ....................................... 110 Volume Analysis..................................................... 110 Chart 57: Global Polysulfone (PSU) Market Analysis (2012- 2022) by Geographic Region – United States, Europe, Asia- Pacific and Rest of World in Metric Tons ....................... 110 Chart 58: Glance at 2012, 2017 and 2022 Global Polysulfone (PSU) Volume Market Share (%) by Geographic Region – United States, Europe, Asia-Pacific and Rest of World ......................................................... 111 Value Analysis ........................................................ 112 Chart 59: Global Polysulfone (PSU) Market Analysis (2012- 2022) by Geographic Region – United States, Europe, Asia- Pacific and Rest of World in USD Million ....................... 112 Chart 60: Glance at 2012, 2017 and 2022 Global Polysulfone (PSU) Value Market Share (%) by Geographic Region – United States, Europe, Asia-Pacific and Rest of World ............................................................................ 113 4.2.1.2 Polyphenylsulfone (PPSU) .......................... 114 Volume Analysis..................................................... 114 Chart 61: Global Polyphenylsulfone (PPSU) Market Analysis (2012-2022) by Geographic Region – United States, Europe and Asia-Pacific in Metric Tons .............. 114 Chart 62: Glance at 2012, 2017 and 2022 Global Polyphenylsulfone (PPSU) Volume Market Share (%) by Geographic Region – United States, Europe and Asia- Pacific ........................................................................... 115 Value Analysis ........................................................ 116 Chart 63: Global Polyphenylsulfone (PPSU) Market Analysis (2012-2022) by Geographic Region – United States, Europe and Asia-Pacific in USD Million ............. 116 Chart 64: Glance at 2012, 2017 and 2022 Global Polyphenylsulfone (PPSU) Value Market Share (%) by Geographic Region – United States, Europe and Asia- Pacific ........................................................................... 117 4.2.1.3 Polyethersulfone (PESU) ............................ 118 Volume Analysis .................................................... 118 Chart 65: Global Polyethersulfone (PESU) Market Analysis (2012-2022) by Geographic Region – United States, Europe, Asia-Pacific and Rest of World in Metric Tons . 118 Chart 66: Glance at 2012, 2017 and 2022 Global Polyethersulfone (PESU) Volume Market Share (%) by Geographic Region – United States, Europe, Asia-Pacific and Rest of World ......................................................... 119 Value Analysis ........................................................ 120 Chart 67: Global Polyethersulfone (PESU) Market Analysis (2012-2022) by Geographic Region – United States, Europe, Asia-Pacific and Rest of World in USD Million.. 120 Chart 68: Glance at 2012, 2017 and 2022 Global Polyethersulfone (PESU) Value Market Share (%) by Geographic Region – United States, Europe, Asia-Pacific and Rest of World ......................................................... 121 4.2.2 Global Sulfone Polymers Product Type Market Overview by End-Use Sector .................................. 122 4.2.2.1 Polysulfone (PSU) & Polyphenylsulfone (PPSU) .. 122 Volume Analysis .................................................... 122 Chart 69: Global Polysulfone (PSU) & Polyphenylsulfone (PPSU) Market Analysis (2012-2022) by End-Use Sector – Aerospace & Military, Automotive, Building & Construction, Electrical & Electronics, Food & Household, Mechanical/Industrial, Medical & Healthcare and Others in Metric Tons .............................................................. 122 Chart 70: Glance at 2012, 2017 and 2022 Global Polysulfone (PSU) & Polyphenylsulfone (PPSU) Volume Market Share (%) by End-Use Sector – Aerospace & Military, Automotive, Building & Construction, Electrical & Electronics, Food & Household, Mechanical/Industrial, Medical & Healthcare and Others ................................ 123 Value Analysis ........................................................ 124 Chart 71: Global Polysulfone (PSU) & Polyphenylsulfone (PPSU) Market Analysis (2012-2022) by End-Use Sector – Aerospace & Military, Automotive, Building & Construction, Electrical & Electronics, Food & Household, Mechanical/Industrial, Medical & Healthcare and Others in USD Million ............................................................... 124 Chart 72: Glance at 2012, 2017 and 2022 Global Polysulfone (PSU) & Polyphenylsulfone (PPSU) Value Market Share (%) by End-Use Sector – Aerospace & Military, Automotive, Building & Construction, Electrical & Electronics, Food & Household, Mechanical/Industrial, Medical & Healthcare and Others ................................ 125 4.2.2.2 Polyethersulfone (PESU) ............................ 126 Volume Analysis .................................................... 126 Chart 73: Global Polyethersulfone (PESU) Market Analysis (2012-2022) by End-Use Sector – Aerospace & Military, Automotive, Electrical & Electronics, Food & Household, Mechanical/Industrial, Medical & Healthcare and Others in Metric Tons .............................................................. 126 Chart 74: Glance at 2012, 2017 and 2022 Global Polyethersulfone (PESU) Volume Market Share (%) by End- Use Sector – Aerospace & Military, Automotive, Electrical & Electronics, Food & Household, Mechanical/Industrial, Medical & Healthcare and Others ................................ 127 Value Analysis ........................................................ 128 Chart 75: Global Polyethersulfone (PESU) Market Analysis (2012-2022) by End-Use Sector – Aerospace & Military, Automotive, Electrical & Electronics, Food & Household, Mechanical/Industrial, Medical & Healthcare and Others in USD Million ............................................................... 128 Chart 76: Glance at 2012, 2017 and 2022 Global Polyethersulfone (PESU) Value Market Share (%) by End- Use Sector – Aerospace & Military, Automotive, Electrical & Electronics, Food & Household, Mechanical/Industrial, Medical & Healthcare and Others ................................ 129 Click here to buy the report Page 4
Sulfone Polymers (PSU, PPSU & PESU) – A Global Market Overview August 2016 |400 Pages | 342 Charts | Price $4500 Chart 91: Glance at 2012, 2017 and 2022 United States Polysulfone (PSU) & Polyphenylsulfone (PPSU) Volume Market Share (%) by End-Use Sector – Aerospace & Military, Automotive, Building & Construction, Electrical & Electronics, Food & Household, Mechanical/Industrial, Medical & Healthcare and Others ................................. 144 Value Analysis ........................................................ 145 Chart 92: United States Polysulfone (PSU) & Polyphenylsulfone (PPSU) Market Analysis (2012-2022) by End-Use Sector – Aerospace & Military, Automotive, Building & Construction, Electrical & Electronics, Food & Household, Mechanical/Industrial, Medical & Healthcare and Others in USD Million ............................................. 145 Chart 93: Glance at 2012, 2017 and 2022 United States Polysulfone (PSU) & Polyphenylsulfone (PPSU) Value Market Share (%) by End-Use Sector – Aerospace & Military, Automotive, Building & Construction, Electrical & Electronics, Food & Household, Mechanical/Industrial, Medical & Healthcare and Others ................................. 146 1.2.1.2 Polyethersulfone (PESU) ............................ 147 Volume Analysis..................................................... 147 Chart 94: United States Polyethersulfone (PESU) Market Analysis (2012-2022) by End-Use Sector – Aerospace & Military, Automotive, Electrical & Electronics, Food & Household, Mechanical/Industrial, Medical & Healthcare and Others in Metric Tons ............................................ 147 Chart 95: Glance at 2012, 2017 and 2022 United States Polyethersulfone (PESU) Volume Market Share (%) by End- Use Sector – Aerospace & Military, Automotive, Electrical & Electronics, Food & Household, Mechanical/Industrial, Medical & Healthcare and Others ................................. 148 Value Analysis ........................................................ 149 Chart 96: United States Polyethersulfone (PESU) Market Analysis (2012-2022) by End-Use Sector – Aerospace & Military, Automotive, Electrical & Electronics, Food & Household, Mechanical/Industrial, Medical & Healthcare and Others in USD Million ............................................. 149 Chart 97: Glance at 2012, 2017 and 2022 United States Polyethersulfone (PESU) Value Market Share (%) by End- Use Sector – Aerospace & Military, Automotive, Electrical & Electronics, Food & Household, Mechanical/Industrial, Medical & Healthcare and Others ................................. 150 Value Analysis ........................................................ 158 Chart 105: European Sulfone Polymers Market Analysis (2012-2022) by End-Use Sector – Aerospace & Military, Automotive, Building & Construction, Electrical & Electronics, Food & Household, Mechanical/Industrial, Medical & Healthcare and Others in USD Million ......... 158 Chart 106: Glance at 2012, 2017 and 2022 European Sulfone Polymers Value Market Share (%) by End-Use Sector – Aerospace & Military, Automotive, Building & Construction, Electrical & Electronics, Food & Household, Mechanical/Industrial, Medical & Healthcare and Others ... 159 2.3 European Sulfone Polymers Market Overview by Polymer Type ......................................................... 160 Volume Analysis .................................................... 160 Chart 107: European Sulfone Polymers Market Analysis (2012-2022) by Polymer Type – Polysulfone (PSU), Polyphenylsulfone (PPSU) and Polyethersulfone (PESU) in Metric Tons .................................................................. 160 Chart 108: Glance at 2012, 2017 and 2022 European Sulfone Polymers Volume Market Share (%) by Polymer Type – Polysulfone (PSU), Polyphenylsulfone (PPSU) and Polyethersulfone (PESU) ............................................... 161 Value Analysis ........................................................ 162 Chart 109: European Sulfone Polymers Market Analysis (2012-2022) by Polymer Type – Polysulfone (PSU), Polyphenylsulfone (PPSU) and Polyethersulfone (PESU) in USD Million ................................................................... 162 Chart 110: Glance at 2012, 2017 and 2022 European Sulfone Polymers Value Market Share (%) by Polymer Type – Polysulfone (PSU), Polyphenylsulfone (PPSU) and Polyethersulfone (PESU) ............................................... 163 2.3.1 Sulfone Polymers Product Type Market Overview by European Region ............................... 164 2.3.1.1 Polysulfone (PSU) ....................................... 164 Volume Analysis .................................................... 164 Chart 111: European Polysulfone (PSU) Market Analysis (2012-2022) by Geographic Region – France, Germany, Italy, The United Kingdom and Rest of Europe in Metric Tons .. 164 Chart 112: Glance at 2012, 2017 and 2022 European Polysulfone (PSU) Volume Market Share (%) by Geographic Region – France, Germany, Italy, The United Kingdom and Rest of Europe ........................................ 165 Value Analysis ........................................................ 166 Chart 113: European Polysulfone (PSU) Market Analysis (2012- 2022) by Geographic Region – France, Germany, Italy, The United Kingdom and Rest of Europe in USD Million ............. 166 Chart 114: Glance at 2012, 2017 and 2022 European Polysulfone (PSU) Value Market Share (%) by Geographic Region – France, Germany, Italy, The United Kingdom and Rest of Europe .............................................................. 167 2.3.1.2 Polyphenylsulfone (PPSU) .......................... 168 Volume Analysis .................................................... 168 Chart 115: European Polyphenylsulfone (PPSU) Market Analysis (2012-2022) by Geographic Region – France, Germany, Italy, The United Kingdom and Rest of Europe in Metric Tons .................................................................. 168 Chart 116: Glance at 2012, 2017 and 2022 European Polyphenylsulfone (PPSU) Volume Market Share (%) by Geographic Region – France, Germany, Italy, The United Kingdom and Rest of Europe ........................................ 169 Value Analysis ........................................................ 170 Chart 117: European Polyphenylsulfone (PPSU) Market Analysis (2012-2022) by Geographic Region – France, Germany, Italy, The United Kingdom and Rest of Europe in USD Million .................. 170 Chart 118: Glance at 2012, 2017 and 2022 European Polyphenylsulfone (PPSU) Value Market Share (%) by Geographic Region – France, Germany, Italy, The United Kingdom and Rest of Europe ........................................ 171 2.3.1.3 Polyethersulfone (PESU) ............................ 172 Volume Analysis .................................................... 172 Chart 119: European Polyethersulfone (PESU) Market Analysis (2012-2022) by Geographic Region – France, Germany, Italy, The United Kingdom and Rest of Europe in Metric Tons ..... 172 Chart 120: Glance at 2012, 2017 and 2022 European Polyethersulfone (PESU) Volume Market Share (%) by Geographic Region – France, Germany, Italy, The United Kingdom and Rest of Europe ........................................ 173 PART B: REGIONAL MARKET PERSPECTIVE ..130 Global Sulfone Polymers Market Overview by Geographic Region ............................................. 130 Volume Analysis ..................................................... 130 Chart 77: Global Sulfone Polymers Market Analysis (2012- 2022) by Geographic Region – United States, Europe, Asia- Pacific and Rest of World in Metric Tons ....................... 130 Chart 78: Glance at 2012, 2017 and 2022 Global Sulfone Polymers Volume Market Share (%) by Geographic Region – United States, Europe, Asia-Pacific and Rest of World ..... 131 Value Analysis ........................................................ 132 Chart 79: Global Sulfone Polymers Market Analysis (2012- 2022) by Geographic Region – United States, Europe, Asia- Pacific and Rest of World in USD Million ....................... 132 Chart 80: Glance at 2012, 2017 and 2022 Global Sulfone Polymers Value Market Share (%) by Geographic Region – United States, Europe, Asia-Pacific and Rest of World .. 133 REGIONAL MARKET OVERVIEW ........................... 134 1. THE UNITED STATES ........................................ 134 Chart 81: United States Sulfone Polymers Market Analysis (2012- 2022) in Volume (Metric Tons) and Value (USD Million) ........... 134 1.1 United States Sulfone Polymers Market Overview by End-Use Sector .................................................. 135 Volume Analysis ..................................................... 135 Chart 82: United States Sulfone Polymers Market Analysis (2012-2022) by End-Use Sector – Aerospace & Military, Automotive, Building & Construction, Electrical & Electronics, Food & Household, Mechanical/Industrial, Medical & Healthcare and Others in Metric Tons .......... 135 Chart 83: Glance at 2012, 2017 and 2022 United States Sulfone Polymers Volume Market Share (%) by End-Use Sector – Aerospace & Military, Automotive, Building & Construction, Electrical & Electronics, Food & Household, Mechanical/Industrial, Medical & Healthcare and Others ... 136 Value Analysis ........................................................ 137 Chart 84: United States Sulfone Polymers Market Analysis (2012-2022) by End-Use Sector – Aerospace & Military, Automotive, Building & Construction, Electrical & Electronics, Food & Household, Mechanical/Industrial, Medical & Healthcare and Others in USD Million .......... 137 Chart 85: Glance at 2012, 2017 and 2022 United States Sulfone Polymers Value Market Share (%) by End-Use Sector – Aerospace & Military, Automotive, Building & Construction, Electrical & Electronics, Food & Household, Mechanical/Industrial, Medical & Healthcare and Others ... 138 1.2 United States Sulfone Polymers Market Overview by Polymer Type .................................................... 139 Volume Analysis ..................................................... 139 Chart 86: United States Sulfone Polymers Market Analysis (2012-2022) by Polymer Type – Polysulfone (PSU), Polyphenylsulfone (PPSU) and Polyethersulfone (PESU) in Metric Tons ................................................................... 139 Chart 87: Glance at 2012, 2017 and 2022 United States Sulfone Polymers Volume Market Share (%) by Polymer Type – Polysulfone (PSU), Polyphenylsulfone (PPSU) and Polyethersulfone (PESU) ................................................ 140 Value Analysis ........................................................ 141 Chart 88: United States Sulfone Polymers Market Analysis (2012-2022) by Polymer Type – Polysulfone (PSU), Polyphenylsulfone (PPSU) and Polyethersulfone (PESU) in USD Million ................................................................... 141 Chart 89: Glance at 2012, 2017 and 2022 United States Sulfone Polymers Value Market Share (%) by Polymer Type – Polysulfone (PSU), Polyphenylsulfone (PPSU) and Polyethersulfone (PESU) ................................................ 142 1.2.1 United States Sulfone Polymers Product Type Market Overview by End-Use Sector ..................... 143 1.2.1.1 Polysulfone (PSU) & Polyphenylsulfone (PPSU) .. 143 Volume Analysis ..................................................... 143 Chart 90: United States Polysulfone (PSU) & Polyphenylsulfone (PPSU) Market Analysis (2012-2022) by End-Use Sector – Aerospace & Military, Automotive, Building & Construction, Electrical & Electronics, Food & Household, Mechanical/Industrial, Medical & Healthcare and Others in Metric Tons ............................................. 143 2. EUROPE .......................................................... 151 Chart 98: European Sulfone Polymers Market Analysis (2012-2022) in Volume (Metric Tons) and Value (USD Million) ......................................................................... 151 2.1 European Sulfone Polymers Market Overview by Geographic Region ................................................ 152 Volume Analysis..................................................... 152 Chart 99: European Sulfone Polymers Market Analysis (2012-2022) by Geographic Region – France, Germany, Italy, The United Kingdom and Rest of Europe in Metric Tons .. 152 Chart 100: Glance at 2012, 2017 and 2022 European Sulfone Polymers Volume Market Share (%) by Geographic Region – France, Germany, Italy, The United Kingdom and Rest of Europe .............................................................. 153 Value Analysis ........................................................ 154 Chart 101: European Sulfone Polymers Market Analysis (2012- 2022) by Geographic Region – France, Germany, Italy, The United Kingdom and Rest of Europe in USD Million ............. 154 Chart 102: Glance at 2012, 2017 and 2022 European Sulfone Polymers Value Market Share (%) by Geographic Region – France, Germany, Italy, The United Kingdom and Rest of Europe .............................................................. 155 2.2 European Sulfone Polymers Market Overview by End-Use Sector ...................................................... 156 Volume Analysis..................................................... 156 Chart 103: European Sulfone Polymers Market Analysis (2012-2022) by End-Use Sector – Aerospace & Military, Automotive, Building & Construction, Electrical & Electronics, Food & Household, Mechanical/Industrial, Medical & Healthcare and Others in Metric Tons ......... 156 Chart 104: Glance at 2012, 2017 and 2022 European Sulfone Polymers Volume Market Share (%) by End-Use Sector – Aerospace & Military, Automotive, Building & Construction, Electrical & Electronics, Food & Household, Mechanical/Industrial, Medical & Healthcare and Others ... 157 Click here to buy the report Page 5
Sulfone Polymers (PSU, PPSU & PESU) – A Global Market Overview August 2016 |400 Pages | 342 Charts | Price $4500 Chart 147: Glance at 2012, 2017 and 2022 French Polyethersulfone (PESU) Value Market Share (%) by End- Use Sector – Aerospace & Military, Automotive, Electrical & Electronics, Food & Household, Mechanical/Industrial, Medical & Healthcare and Others ................................ 200 2.4.2 Germany .................................................... 201 Chart 148: German Sulfone Polymers Market Analysis (2012- 2022) in Volume (Metric Tons) and Value (USD Million) .. 201 2.4.2.1 German Sulfone Polymers Market Overview by End-Use Sector .................................................. 202 Volume Analysis .................................................... 202 Chart 149: German Sulfone Polymers Market Analysis (2012-2022) by End-Use Sector – Aerospace & Military, Automotive, Building & Construction, Electrical & Electronics, Food & Household, Mechanical/Industrial, Medical & Healthcare and Others in Metric Tons ......... 202 Chart 150: Glance at 2012, 2017 and 2022 German Sulfone Polymers Volume Market Share (%) by End-Use Sector – Aerospace & Military, Automotive, Building & Construction, Electrical & Electronics, Food & Household, Mechanical/Industrial, Medical & Healthcare and Others ... 203 Value Analysis ........................................................ 204 Chart 151: German Sulfone Polymers Market Analysis (2012-2022) by End-Use Sector – Aerospace & Military, Automotive, Building & Construction, Electrical & Electronics, Food & Household, Mechanical/Industrial, Medical & Healthcare and Others in USD Million ......... 204 Chart 152: Glance at 2012, 2017 and 2022 German Sulfone Polymers Value Market Share (%) by End-Use Sector – Aerospace & Military, Automotive, Building & Construction, Electrical & Electronics, Food & Household, Mechanical/Industrial, Medical & Healthcare and Others ... 205 2.4.2.2 German Sulfone Polymers Market Overview by Polymer Type .................................................... 206 Volume Analysis .................................................... 206 Chart 153: German Sulfone Polymers Market Analysis (2012- 2022) by Polymer Type – Polysulfone (PSU), Polyphenylsulfone (PPSU) and Polyethersulfone (PESU) in Metric Tons ............ 206 Chart 154: Glance at 2012, 2017 and 2022 German Sulfone Polymers Volume Market Share (%) by Polymer Type – Polysulfone (PSU), Polyphenylsulfone (PPSU) and Polyethersulfone (PESU) ............................................... 207 Value Analysis ........................................................ 208 Chart 155: German Sulfone Polymers Market Analysis (2012- 2022) by Polymer Type – Polysulfone (PSU), Polyphenylsulfone (PPSU) and Polyethersulfone (PESU) in USD Million ............. 208 Chart 156: Glance at 2012, 2017 and 2022 German Sulfone Polymers Value Market Share (%) by Polymer Type – Polysulfone (PSU), Polyphenylsulfone (PPSU) and Polyethersulfone (PESU) ............................................... 209 2.4.2.2.1 German Sulfone Polymers Product Type Market Overview by End-Use Sector ..................... 210 2.4.2.2.1.1 Polysulfone (PSU) & Polyphenylsulfone (PPSU) ... 210 Volume Analysis .................................................... 210 Chart 157: German Polysulfone (PSU) & Polyphenylsulfone (PPSU) Market Analysis (2012-2022) by End-Use Sector – Aerospace & Military, Automotive, Building & Construction, Electrical & Electronics, Food & Household, Mechanical/Industrial, Medical & Healthcare and Others in Metric Tons .............................................................. 210 Chart 158: Glance at 2012, 2017 and 2022 German Polysulfone (PSU) & Polyphenylsulfone (PPSU) Volume Market Share (%) by End-Use Sector – Aerospace & Military, Automotive, Building & Construction, Electrical & Electronics, Food & Household, Mechanical/Industrial, Medical & Healthcare and Others ................................ 211 Value Analysis ........................................................ 212 Chart 159: German Polysulfone (PSU) & Polyphenylsulfone (PPSU) Market Analysis (2012-2022) by End-Use Sector – Aerospace & Military, Automotive, Building & Construction, Electrical & Electronics, Food & Household, Mechanical/Industrial, Medical & Healthcare and Others in USD Million ......... 212 Chart 160: Glance at 2012, 2017 and 2022 German Polysulfone (PSU) & Polyphenylsulfone (PPSU) Value Market Share (%) by End-Use Sector – Aerospace & Military, Automotive, Building & Construction, Electrical & Electronics, Food & Household, Mechanical/Industrial, Medical & Healthcare and Others ................................ 213 Value Analysis ........................................................ 174 Chart 121: European Polyethersulfone (PESU) Market Analysis (2012-2022) by Geographic Region – France, Germany, Italy, The United Kingdom and Rest of Europe in USD Million ...... 174 Chart 122: Glance at 2012, 2017 and 2022 European Polyethersulfone (PESU) Value Market Share (%) by Geographic Region – France, Germany, Italy, The United Kingdom and Rest of Europe ......................................... 175 2.3.2 European Sulfone Polymer Product Type Market Overview by End-Use Sector .................................. 176 2.3.2.1 Polysulfone (PSU) & Polyphenylsulfone (PPSU) .. 176 Volume Analysis ..................................................... 176 Chart 123: European Polysulfone (PSU) & Polyphenylsulfone (PPSU) Market Analysis (2012-2022) by End-Use Sector – Aerospace & Military, Automotive, Building & Construction, Electrical & Electronics, Food & Household, Mechanical/Industrial, Medical & Healthcare and Others in Metric Tons ............................................. 176 Chart 124: Glance at 2012, 2017 and 2022 European Polysulfone (PSU) & Polyphenylsulfone (PPSU) Volume Market Share (%) by End-Use Sector – Aerospace & Military, Automotive, Building & Construction, Electrical & Electronics, Food & Household, Mechanical/Industrial, Medical & Healthcare and Others ................................. 177 Value Analysis ........................................................ 178 Chart 125: European Polysulfone (PSU) & Polyphenylsulfone (PPSU) Market Analysis (2012-2022) by End-Use Sector – Aerospace & Military, Automotive, Building & Construction, Electrical & Electronics, Food & Household, Mechanical/Industrial, Medical & Healthcare and Others in USD Million ............................................. 178 Chart 126: Glance at 2012, 2017 and 2022 European Polysulfone (PSU) & Polyphenylsulfone (PPSU) Value Market Share (%) by End-Use Sector – Aerospace & Military, Automotive, Building & Construction, Electrical & Electronics, Food & Household, Mechanical/Industrial, Medical & Healthcare and Others ................................. 179 2.3.2.2 Polyethersulfone (PESU) ............................ 180 Chart 127: European Polyethersulfone (PESU) Market Analysis (2012-2022) by End-Use Sector – Aerospace & Military, Automotive, Electrical & Electronics, Food & Household, Mechanical/Industrial, Medical & Healthcare and Others in Metric Tons ............................................. 180 Chart 128: Glance at 2012, 2017 and 2022 European Polyethersulfone (PESU) Volume Market Share (%) by End- Use Sector – Aerospace & Military, Automotive, Electrical & Electronics, Food & Household, Mechanical/Industrial, Medical & Healthcare and Others ................................. 181 Value Analysis ........................................................ 182 Chart 129: European Polyethersulfone (PESU) Market Analysis (2012-2022) by End-Use Sector – Aerospace & Military, Automotive, Electrical & Electronics, Food & Household, Mechanical/Industrial, Medical & Healthcare and Others in USD Million ............................................. 182 Chart 130: Glance at 2012, 2017 and 2022 European Polyethersulfone (PESU) Value Market Share (%) by End- Use Sector – Aerospace & Military, Automotive, Electrical & Electronics, Food & Household, Mechanical/Industrial, Medical & Healthcare and Others ................................. 183 2.4 European Sulfone Polymers Market Overview by Country .................................................................. 184 2.4.1 France ........................................................ 184 Chart 131: French Sulfone Polymers Market Analysis (2012- 2022) in Volume (Metric Tons) and Value (USD Million) ...... 184 2.4.1.1 French Sulfone Polymers Market Overview by End-Use Sector ...................................................... 185 Volume Analysis ..................................................... 185 Chart 132: French Sulfone Polymers Market Analysis (2012-2022) by End-Use Sector – Aerospace & Military, Automotive, Building & Construction, Electrical & Electronics, Food & Household, Mechanical/Industrial, Medical & Healthcare and Others in Metric Tons .......... 185 Chart 133: Glance at 2012, 2017 and 2022 French Sulfone Polymers Volume Market Share (%) by End-Use Sector – Aerospace & Military, Automotive, Building & Construction, Electrical & Electronics, Food & Household, Mechanical/Industrial, Medical & Healthcare and Others ... 186 Value Analysis ........................................................ 187 Chart 134: French Sulfone Polymers Market Analysis (2012-2022) by End-Use Sector – Aerospace & Military, Automotive, Building & Construction, Electrical & Electronics, Food & Household, Mechanical/Industrial, Medical & Healthcare and Others in USD Million .......... 187 Chart 135: Glance at 2012, 2017 and 2022 French Sulfone Polymers Value Market Share (%) by End-Use Sector – Aerospace & Military, Automotive, Building & Construction, Electrical & Electronics, Food & Household, Mechanical/Industrial, Medical & Healthcare and Others ... 188 2.4.1.2 French Sulfone Polymers Market Overview by Polymer Type ......................................................... 189 Volume Analysis..................................................... 189 Chart 136: French Sulfone Polymers Market Analysis (2012- 2022) by Polymer Type – Polysulfone (PSU), Polyphenylsulfone (PPSU) and Polyethersulfone (PESU) in Metric Tons ............ 189 Chart 137: Glance at 2012, 2017 and 2022 French Sulfone Polymers Volume Market Share (%) by Polymer Type – Polysulfone (PSU), Polyphenylsulfone (PPSU) and Polyethersulfone (PESU) ............................................... 190 Value Analysis ........................................................ 191 Chart 138: French Sulfone Polymers Market Analysis (2012- 2022) by Polymer Type – Polysulfone (PSU), Polyphenylsulfone (PPSU) and Polyethersulfone (PESU) in USD Million ............. 191 Chart 139: Glance at 2012, 2017 and 2022 French Sulfone Polymers Value Market Share (%) by Polymer Type – Polysulfone (PSU), Polyphenylsulfone (PPSU) and Polyethersulfone (PESU) ............................................... 192 2.4.1.2.1 French Sulfone Polymers Product Type Market Overview by End-Use Sector ..................... 193 2.4.1.2.1.1 Polysulfone (PSU) & Polyphenylsulfone (PPSU) .................................................................... 193 Volume Analysis..................................................... 193 Chart 140: French Polysulfone (PSU) & Polyphenylsulfone (PPSU) Market Analysis (2012-2022) by End-Use Sector – Aerospace & Military, Automotive, Building & Construction, Electrical & Electronics, Food & Household, Mechanical/Industrial, Medical & Healthcare and Others in Metric Tons ............................................................... 193 Chart 141: Glance at 2012, 2017 and 2022 French Polysulfone (PSU) & Polyphenylsulfone (PPSU) Volume Market Share (%) by End-Use Sector – Aerospace & Military, Automotive, Building & Construction, Electrical & Electronics, Food & Household, Mechanical/Industrial, Medical & Healthcare and Others ................................. 194 Value Analysis ........................................................ 195 Chart 142: French Polysulfone (PSU) & Polyphenylsulfone (PPSU) Market Analysis (2012-2022) by End-Use Sector – Aerospace & Military, Automotive, Building & Construction, Electrical & Electronics, Food & Household, Mechanical/Industrial, Medical & Healthcare and Others in USD Million ............................................................... 195 Chart 143: Glance at 2012, 2017 and 2022 French Polysulfone (PSU) & Polyphenylsulfone (PPSU) Value Market Share (%) by End-Use Sector – Aerospace & Military, Automotive, Building & Construction, Electrical & Electronics, Food & Household, Mechanical/Industrial, Medical & Healthcare and Others ................................. 196 2.4.1.2.1.2 Polyethersulfone (PESU) ...................... 197 Volume Analysis..................................................... 197 Chart 144: French Polyethersulfone (PESU) Market Analysis (2012-2022) by End-Use Sector – Aerospace & Military, Automotive, Electrical & Electronics, Food & Household, Mechanical/Industrial, Medical & Healthcare and Others in Metric Tons ............................................ 197 Chart 145: Glance at 2012, 2017 and 2022 French Polyethersulfone (PESU) Volume Market Share (%) by End- Use Sector – Aerospace & Military, Automotive, Electrical & Electronics, Food & Household, Mechanical/Industrial, Medical & Healthcare and Others ................................. 198 Value Analysis ........................................................ 199 Chart 146: French Polyethersulfone (PESU) Market Analysis (2012-2022) by End-Use Sector – Aerospace & Military, Automotive, Electrical & Electronics, Food & Household, Mechanical/Industrial, Medical & Healthcare and Others in USD Million ............................................. 199 Click here to buy the report Page 6
Sulfone Polymers (PSU, PPSU & PESU) – A Global Market Overview August 2016 |400 Pages | 342 Charts | Price $4500 Chart 174: Italian Polysulfone (PSU) & Polyphenylsulfone (PPSU) Market Analysis (2012-2022) by End-Use Sector – Aerospace & Military, Automotive, Building & Construction, Electrical & Electronics, Food & Household, Mechanical/Industrial, Medical & Healthcare and Others in Metric Tons ............................................................... 227 Chart 175: Glance at 2012, 2017 and 2022 Italian Polysulfone (PSU) & Polyphenylsulfone (PPSU) Volume Market Share (%) by End-Use Sector – Aerospace & Military, Automotive, Building & Construction, Electrical & Electronics, Food & Household, Mechanical/Industrial, Medical & Healthcare and Others ................................. 228 Value Analysis ........................................................ 229 Chart 176: Italian Polysulfone (PSU) & Polyphenylsulfone (PPSU) Market Analysis (2012-2022) by End-Use Sector – Aerospace & Military, Automotive, Building & Construction, Electrical & Electronics, Food & Household, Mechanical/Industrial, Medical & Healthcare and Others in USD Million ............................................................... 229 Chart 177: Glance at 2012, 2017 and 2022 Italian Polysulfone (PSU) & Polyphenylsulfone (PPSU) Value Market Share (%) by End-Use Sector – Aerospace & Military, Automotive, Building & Construction, Electrical & Electronics, Food & Household, Mechanical/Industrial, Medical & Healthcare and Others ................................. 230 2.4.3.2.1.2 Polyethersulfone (PESU) ...................... 231 Volume Analysis..................................................... 231 Chart 178: Italian Polyethersulfone (PESU) Market Analysis (2012-2022) by End-Use Sector – Aerospace & Military, Automotive, Electrical & Electronics, Food & Household, Mechanical/Industrial, Medical & Healthcare and Others in Metric Tons ............................................................... 231 Chart 179: Glance at 2012, 2017 and 2022 Italian Polyethersulfone (PESU) Volume Market Share (%) by End- Use Sector – Aerospace & Military, Automotive, Electrical & Electronics, Food & Household, Mechanical/Industrial, Medical & Healthcare and Others ................................. 232 Value Analysis ........................................................ 233 Chart 180: Italian Polyethersulfone (PESU) Market Analysis (2012-2022) by End-Use Sector – Aerospace & Military, Automotive, Electrical & Electronics, Food & Household, Mechanical/Industrial, Medical & Healthcare and Others in USD Million ............................................................... 233 Chart 181: Glance at 2012, 2017 and 2022 Italian Polyethersulfone (PESU) Value Market Share (%) by End- Use Sector – Aerospace & Military, Automotive, Electrical & Electronics, Food & Household, Mechanical/Industrial, Medical & Healthcare and Others ................................. 234 2.4.4 The United Kingdom ................................... 235 Chart 182: UK Sulfone Polymers Market Analysis (2012- 2022) in Volume (Metric Tons) and Value (USD Million) .. 235 2.4.4.1 UK Sulfone Polymers Market Overview by End-Use Sector ...................................................... 236 Volume Analysis..................................................... 236 Chart 183: UK Sulfone Polymers Market Analysis (2012- 2022) by End-Use Sector – Aerospace & Military, Automotive, Building & Construction, Electrical & Electronics, Food & Household, Mechanical/Industrial, Medical & Healthcare and Others in Metric Tons ......... 236 Chart 184: Glance at 2012, 2017 and 2022 UK Sulfone Polymers Volume Market Share (%) by End-Use Sector – Aerospace & Military, Automotive, Building & Construction, Electrical & Electronics, Food & Household, Mechanical/Industrial, Medical & Healthcare and Others ... 237 Value Analysis ........................................................ 238 Chart 185: UK Sulfone Polymers Market Analysis (2012- 2022) by End-Use Sector – Aerospace & Military, Automotive, Building & Construction, Electrical & Electronics, Food & Household, Mechanical/Industrial, Medical & Healthcare and Others in USD Million .......... 238 Chart 186: Glance at 2012, 2017 and 2022 UK Sulfone Polymers Value Market Share (%) by End-Use Sector – Aerospace & Military, Automotive, Building & Construction, Electrical & Electronics, Food & Household, Mechanical/Industrial, Medical & Healthcare and Others ... 239 2.4.4.2 UK Sulfone Polymers Market Overview by Polymer Type ......................................................... 240 2.4.2.2.1.2 Polyethersulfone (PESU) ...................... 214 Volume Analysis ..................................................... 214 Chart 161: German Polyethersulfone (PESU) Market Analysis (2012-2022) by End-Use Sector – Aerospace & Military, Automotive, Electrical & Electronics, Food & Household, Mechanical/Industrial, Medical & Healthcare and Others in Metric Tons ............................................. 214 Chart 162: Glance at 2012, 2017 and 2022 German Polyethersulfone (PESU) Volume Market Share (%) by End- Use Sector – Aerospace & Military, Automotive, Electrical & Electronics, Food & Household, Mechanical/Industrial, Medical & Healthcare and Others ................................. 215 Value Analysis ........................................................ 216 Chart 163: German Polyethersulfone (PESU) Market Analysis (2012-2022) by End-Use Sector – Aerospace & Military, Automotive, Electrical & Electronics, Food & Household, Mechanical/Industrial, Medical & Healthcare and Others in USD Million ............................................. 216 Chart 164: Glance at 2012, 2017 and 2022 German Polyethersulfone (PESU) Value Market Share (%) by End- Use Sector – Aerospace & Military, Automotive, Electrical & Electronics, Food & Household, Mechanical/Industrial, Medical & Healthcare and Others ................................. 217 Volume Analysis .................................................... 240 Chart 187: UK Sulfone Polymers Market Analysis (2012- 2022) by Polymer Type – Polysulfone (PSU), Polyphenylsulfone (PPSU) and Polyethersulfone (PESU) in Metric Tons .................................................................. 240 Chart 188: Glance at 2012, 2017 and 2022 UK Sulfone Polymers Volume Market Share (%) by Polymer Type – Polysulfone (PSU), Polyphenylsulfone (PPSU) and Polyethersulfone (PESU) ............................................... 241 Value Analysis ........................................................ 242 Chart 189: UK Sulfone Polymers Market Analysis (2012-2022) by Polymer Type – Polysulfone (PSU), Polyphenylsulfone (PPSU) and Polyethersulfone (PESU) in USD Million ............. 242 Chart 190: Glance at 2012, 2017 and 2022 UK Sulfone Polymers Value Market Share (%) by Polymer Type – Polysulfone (PSU), Polyphenylsulfone (PPSU) and Polyethersulfone (PESU) ............................................... 243 2.4.4.2.1 UK Sulfone Polymers Product Type Market Overview by End-Use Sector .................................. 244 2.4.4.2.1.1 Polysulfone (PSU) & Polyphenylsulfone (PPSU) .................................................................... 244 Volume Analysis .................................................... 244 Chart 191: UK Polysulfone (PSU) & Polyphenylsulfone (PPSU) Market Analysis (2012-2022) by End-Use Sector – Aerospace & Military, Automotive, Building & Construction, Electrical & Electronics, Food & Household, Mechanical/Industrial, Medical & Healthcare and Others in Metric Tons .............................................................. 244 Chart 192: Glance at 2012, 2017 and 2022 UK Polysulfone (PSU) & Polyphenylsulfone (PPSU) Volume Market Share (%) by End-Use Sector – Aerospace & Military, Automotive, Building & Construction, Electrical & Electronics, Food & Household, Mechanical/Industrial, Medical & Healthcare and Others ................................ 245 Value Analysis ........................................................ 246 Chart 193: UK Polysulfone (PSU) & Polyphenylsulfone (PPSU) Market Analysis (2012-2022) by End-Use Sector – Aerospace & Military, Automotive, Building & Construction, Electrical & Electronics, Food & Household, Mechanical/Industrial, Medical & Healthcare and Others in USD Million ............................................................... 246 Chart 194: Glance at 2012, 2017 and 2022 UK Polysulfone (PSU) & Polyphenylsulfone (PPSU) Value Market Share (%) by End-Use Sector – Aerospace & Military, Automotive, Building & Construction, Electrical & Electronics, Food & Household, Mechanical/Industrial, Medical & Healthcare and Others .................................................................... 247 2.4.4.2.1.2 Polyethersulfone (PESU) ...................... 248 Volume Analysis .................................................... 248 Chart 195: UK Polyethersulfone (PESU) Market Analysis (2012-2022) by End-Use Sector – Aerospace & Military, Automotive, Electrical & Electronics, Food & Household, Mechanical/Industrial, Medical & Healthcare and Others in Metric Tons .............................................................. 248 Chart 196: Glance at 2012, 2017 and 2022 UK Polyethersulfone (PESU) Volume Market Share (%) by End- Use Sector – Aerospace & Military, Automotive, Electrical & Electronics, Food & Household, Mechanical/Industrial, Medical & Healthcare and Others ................................ 249 Value Analysis ........................................................ 250 Chart 197: UK Polyethersulfone (PESU) Market Analysis (2012-2022) by End-Use Sector – Aerospace & Military, Automotive, Electrical & Electronics, Food & Household, Mechanical/Industrial, Medical & Healthcare and Others in USD Million ............................................................... 250 Chart 198: Glance at 2012, 2017 and 2022 UK Polyethersulfone (PESU) Value Market Share (%) by End- Use Sector – Aerospace & Military, Automotive, Electrical & Electronics, Food & Household, Mechanical/Industrial, Medical & Healthcare and Others ................................ 251 2.4.3 Italy ........................................................... 218 Chart 165: Italian Sulfone Polymers Market Analysis (2012- 2022) in Volume (Metric Tons) and Value (USD Million) 218 2.4.3.1 Italian Sulfone Polymers Market Overview by End-Use Sector ...................................................... 219 Volume Analysis ..................................................... 219 Chart 166: Italian Sulfone Polymers Market Analysis (2012- 2022) by End-Use Sector – Aerospace & Military, Automotive, Building & Construction, Electrical & Electronics, Food & Household, Mechanical/Industrial, Medical & Healthcare and Others in Metric Tons .......... 219 Chart 167: Glance at 2012, 2017 and 2022 Italian Sulfone Polymers Volume Market Share (%) by End-Use Sector – Aerospace & Military, Automotive, Building & Construction, Electrical & Electronics, Food & Household, Mechanical/Industrial, Medical & Healthcare and Others ... 220 Value Analysis ........................................................ 221 Chart 168: Italian Sulfone Polymers Market Analysis (2012- 2022) by End-Use Sector – Aerospace & Military, Automotive, Building & Construction, Electrical & Electronics, Food & Household, Mechanical/Industrial, Medical & Healthcare and Others in USD Million .......... 221 Chart 169: Glance at 2012, 2017 and 2022 Italian Sulfone Polymers Value Market Share (%) by End-Use Sector – Aerospace & Military, Automotive, Building & Construction, Electrical & Electronics, Food & Household, Mechanical/Industrial, Medical & Healthcare and Others ... 222 2.4.3.2 Italian Sulfone Polymers Market Overview by Polymer Type ......................................................... 223 Volume Analysis ..................................................... 223 Chart 170: Italian Sulfone Polymers Market Analysis (2012- 2022) by Polymer Type – Polysulfone (PSU), Polyphenylsulfone (PPSU) and Polyethersulfone (PESU) in Metric Tons ................................................................... 223 Chart 171: Glance at 2012, 2017 and 2022 Italian Sulfone Polymers Volume Market Share (%) by Polymer Type – Polysulfone (PSU), Polyphenylsulfone (PPSU) and Polyethersulfone (PESU) ................................................ 224 Value Analysis ........................................................ 225 Chart 172: Italian Sulfone Polymers Market Analysis (2012- 2022) by Polymer Type – Polysulfone (PSU), Polyphenylsulfone (PPSU) and Polyethersulfone (PESU) in USD Million ................................................................... 225 Chart 173: Glance at 2012, 2017 and 2022 Italian Sulfone Polymers Value Market Share (%) by Polymer Type – Polysulfone (PSU), Polyphenylsulfone (PPSU) and Polyethersulfone (PESU) ................................................ 226 2.4.3.2.1 Italian Sulfone Polymers Product Type Market Overview by End-Use Sector ..................... 227 2.4.3.2.1.1 Polysulfone (PSU) & Polyphenylsulfone (PPSU) .................................................................... 227 Volume Analysis ..................................................... 227 2.4.5 Rest of Europe ............................................ 252 Chart 199: Rest of Europe Sulfone Polymers Market Analysis (2012-2022) in Volume (Metric Tons) and Value (USD Million) ................................................................ 252 2.4.5.1 Rest of Europe Sulfone Polymers Market Overview by End-Use Sector .................................. 253 Click here to buy the report Page 7
Sulfone Polymers (PSU, PPSU & PESU) – A Global Market Overview August 2016 |400 Pages | 342 Charts | Price $4500 Volume Analysis ..................................................... 253 Chart 200: Rest of Europe Sulfone Polymers Market Analysis (2012-2022) by End-Use Sector – Aerospace & Military, Automotive, Building & Construction, Electrical & Electronics, Food & Household, Mechanical/Industrial, Medical & Healthcare and Others in Metric Tons .......... 253 Chart 201: Glance at 2012, 2017 and 2022 Rest of Europe Sulfone Polymers Volume Market Share (%) by End-Use Sector – Aerospace & Military, Automotive, Building & Construction, Electrical & Electronics, Food & Household, Mechanical/Industrial, Medical & Healthcare and Others ... 254 Value Analysis ........................................................ 255 Chart 202: Rest of Europe Sulfone Polymers Market Analysis (2012-2022) by End-Use Sector – Aerospace & Military, Automotive, Building & Construction, Electrical & Electronics, Food & Household, Mechanical/Industrial, Medical & Healthcare and Others in USD Million .......... 255 Chart 203: Glance at 2012, 2017 and 2022 Rest of Europe Sulfone Polymers Value Market Share (%) by End-Use Sector – Aerospace & Military, Automotive, Building & Construction, Electrical & Electronics, Food & Household, Mechanical/Industrial, Medical & Healthcare and Others ... 256 2.4.5.2 Rest of Europe Sulfone Polymers Market Overview by Polymer Type .................................... 257 Volume Analysis ..................................................... 257 Chart 204: Rest of Europe Sulfone Polymers Market Analysis (2012-2022) by Polymer Type – Polysulfone (PSU), Polyphenylsulfone (PPSU) and Polyethersulfone (PESU) in Metric Tons ................................................................... 257 Chart 205: Glance at 2012, 2017 and 2022 Rest of Europe Sulfone Polymers Volume Market Share (%) by Polymer Type – Polysulfone (PSU), Polyphenylsulfone (PPSU) and Polyethersulfone (PESU) ................................................ 258 Value Analysis ........................................................ 259 Chart 206: Rest of Europe Sulfone Polymers Market Analysis (2012-2022) by Polymer Type – Polysulfone (PSU), Polyphenylsulfone (PPSU) and Polyethersulfone (PESU) in USD Million ................................................................... 259 Chart 207: Glance at 2012, 2017 and 2022 Rest of Europe Sulfone Polymers Value Market Share (%) by Polymer Type – Polysulfone (PSU), Polyphenylsulfone (PPSU) and Polyethersulfone (PESU) ................................................ 260 2.4.5.2.1 Rest of Europe Sulfone Polymers Product Type Market Overview by End-Use Sector ............ 261 2.4.5.2.1.1 Polysulfone (PSU) & Polyphenylsulfone (PPSU) ....261 Volume Analysis ..................................................... 261 Chart 208: Rest of Europe Polysulfone (PSU) & Polyphenylsulfone (PPSU) Market Analysis (2012-2022) by End-Use Sector – Aerospace & Military, Automotive, Building & Construction, Electrical & Electronics, Food & Household, Mechanical/Industrial, Medical & Healthcare and Others in Metric Tons ............................................. 261 Chart 209: Glance at 2012, 2017 and 2022 Rest of Europe Polysulfone (PSU) & Polyphenylsulfone (PPSU) Volume Market Share (%) by End-Use Sector – Aerospace & Military, Automotive, Building & Construction, Electrical & Electronics, Food & Household, Mechanical/Industrial, Medical & Healthcare and Others ................................. 262 Value Analysis ........................................................ 263 Chart 210: Rest of Europe Polysulfone (PSU) & Polyphenylsulfone (PPSU) Market Analysis (2012-2022) by End-Use Sector – Aerospace & Military, Automotive, Building & Construction, Electrical & Electronics, Food & Household, Mechanical/Industrial, Medical & Healthcare and Others in USD Million ............................................. 263 Chart 211: Glance at 2012, 2017 and 2022 Rest of Europe Polysulfone (PSU) & Polyphenylsulfone (PPSU) Value Market Share (%) by End-Use Sector – Aerospace & Military, Automotive, Building & Construction, Electrical & Electronics, Food & Household, Mechanical/Industrial, Medical & Healthcare and Others ................................. 264 2.4.5.2.1.2 Polyethersulfone (PESU) ...................... 265 Volume Analysis ..................................................... 265 Chart 212: Rest of Europe Polyethersulfone (PESU) Market Analysis (2012-2022) by End-Use Sector – Aerospace & Military, Automotive, Electrical & Electronics, Food & Household, Mechanical/Industrial, Medical & Healthcare and Others in Metric Tons ............................................. 265 Chart 213: Glance at 2012, 2017 and 2022 Rest of Europe Polyethersulfone (PESU) Volume Market Share (%) by End- Use Sector – Aerospace & Military, Automotive, Electrical & Electronics, Food & Household, Mechanical/Industrial, Medical & Healthcare and Others ................................. 266 Value Analysis ........................................................ 267 Chart 214: Rest of Europe Polyethersulfone (PESU) Market Analysis (2012-2022) by End-Use Sector – Aerospace & Military, Automotive, Electrical & Electronics, Food & Household, Mechanical/Industrial, Medical & Healthcare and Others in USD Million ............................................. 267 Chart 215: Glance at 2012, 2017 and 2022 Rest of Europe Polyethersulfone (PESU) Value Market Share (%) by End- Use Sector – Aerospace & Military, Automotive, Electrical & Electronics, Food & Household, Mechanical/Industrial, Medical & Healthcare and Others ................................. 268 Chart 228: Glance at 2012, 2017 and 2022 Asia-Pacific Sulfone Polymers Value Market Share (%) by Polymer Type – Polysulfone (PSU), Polyphenylsulfone (PPSU) and Polyethersulfone (PESU) ............................................... 281 3.3.1 Sulfone Polymers Product Type Market Overview by Asia-Pacific Region ............................ 282 3.3.1.1 Polysulfone (PSU) ....................................... 282 Volume Analysis .................................................... 282 Chart 229: Asia-Pacific Polysulfone (PSU) Market Analysis (2012-2022) by Geographic Region – China, Japan, South Korea and Rest of APAC in Metric Tons ........................ 282 Chart 230: Glance at 2012, 2017 and 2022 Asia-Pacific Polysulfone (PSU) Volume Market Share (%) by Geographic Region – China, Japan, South Korea and Rest of APAC ..... 283 Value Analysis ........................................................ 284 Chart 231: Asia-Pacific Polysulfone (PSU) Market Analysis (2012-2022) by Geographic Region – China, Japan, South Korea and Rest of APAC in USD Million......................... 284 Chart 232: Glance at 2012, 2017 and 2022 Asia-Pacific Polysulfone (PSU) Value Market Share (%) by Geographic Region – China, Japan, South Korea and Rest of APAC . 285 3.3.1.2 Polyphenylsulfone (PPSU) .......................... 286 Volume Analysis .................................................... 286 Chart 233: Asia-Pacific Polyphenylsulfone (PPSU) Market Analysis (2012-2022) by Geographic Region – China, Japan, South Korea and Rest of APAC in Metric Tons ... 286 Chart 234: Glance at 2012, 2017 and 2022 Asia-Pacific Polyphenylsulfone (PPSU) Volume Market Share (%) by Geographic Region – China, Japan, South Korea and Rest of APAC ........................................................................ 287 Value Analysis ........................................................ 288 Chart 235: Asia-Pacific Polyphenylsulfone (PPSU) Market Analysis (2012-2022) by Geographic Region – China, Japan, South Korea and Rest of APAC in USD Million .... 288 Chart 236: Glance at 2012, 2017 and 2022 Asia-Pacific Polyphenylsulfone (PPSU) Value Market Share (%) by Geographic Region – China, Japan, South Korea and Rest of APAC ........................................................................ 289 3.3.1.3 Polyethersulfone (PESU) ............................ 290 Volume Analysis .................................................... 290 Chart 237: Asia-Pacific Polyethersulfone (PESU) Market Analysis (2012-2022) by Geographic Region – China, Japan, South Korea and Rest of APAC in Metric Tons ... 290 Chart 238: Glance at 2012, 2017 and 2022 Asia-Pacific Polyethersulfone (PESU) Volume Market Share (%) by Geographic Region – China, Japan, South Korea and Rest of APAC ........................................................................ 291 Value Analysis ........................................................ 292 Chart 239: Asia-Pacific Polyethersulfone (PESU) Market Analysis (2012-2022) by Geographic Region – China, Japan, South Korea and Rest of APAC in USD Million .... 292 Chart 240: Glance at 2012, 2017 and 2022 Asia-Pacific Polyethersulfone (PESU) Value Market Share (%) by Geographic Region – China, Japan, South Korea and Rest of APAC ........................................................................ 293 3.3.2 Asia-Pacific Sulfone Polymers Product Type Market Overview by End-use Sector ..................... 294 3.3.2.1 Polysulfone (PSU) & Polyphenylsulfone (PPSU) .. 294 Volume Analysis .................................................... 294 Chart 241: Asia-Pacific Polysulfone (PSU) & Polyphenylsulfone (PPSU) Market Analysis (2012-2022) by End-use Sector – Aerospace & Military, Automotive, Building & Construction, Electrical & Electronics, Food & Household, Mechanical/Industrial, Medical & Healthcare and Others in Metric Tons ............................................ 294 Chart 242: Glance at 2012, 2017 and 2022 Asia-Pacific Polysulfone (PSU) & Polyphenylsulfone (PPSU) Volume Market Share (%) by End-use Sector – Aerospace & Military, Automotive, Building & Construction, Electrical & Electronics, Food & Household, Mechanical/Industrial, Medical & Healthcare and Others ................................ 295 Value Analysis ........................................................ 296 Chart 243: Asia-Pacific Polysulfone (PSU) & Polyphenylsulfone (PPSU) Market Analysis (2012-2022) by End-use Sector – Aerospace & Military, Automotive, Building & Construction, Electrical & Electronics, Food & Household, Mechanical/Industrial, Medical & Healthcare and Others in USD Million ............................................ 296 3. ASIA-PACIFIC ................................................... 269 Chart 216: Asia-Pacific Sulfone Polymers Market Analysis (2012-2022) in Volume (Metric Tons) and Value (USD Million) ......................................................................... 269 3.1 Asia-Pacific Sulfone Polymers Market Overview by Geographic Region ................................................ 270 Volume Analysis..................................................... 270 Chart 217: Asia-Pacific Sulfone Polymers Market Analysis (2012-2022) by Geographic Region – China, Japan, South Korea and Rest of APAC in Metric Tons ......................... 270 Chart 218: Glance at 2012, 2017 and 2022 Asia-Pacific Sulfone Polymers Volume Market Share (%) by Geographic Region – China, Japan, South Korea and Rest of APAC .. 271 Value Analysis ........................................................ 272 Chart 219: Asia-Pacific Sulfone Polymers Market Analysis (2012-2022) by Geographic Region – China, Japan, South Korea and Rest of APAC in USD Million ......................... 272 Chart 220: Glance at 2012, 2017 and 2022 Asia-Pacific Sulfone Polymers Value Market Share (%) by Geographic Region – China, Japan, South Korea and Rest of APAC .. 273 3.2 Asia-Pacific Sulfone Polymers Market Overview by End-use Sector ....................................................... 274 Volume Analysis..................................................... 274 Chart 221: Asia-Pacific Sulfone Polymers Market Analysis (2012-2022) by End-use Sector – Aerospace & Military, Automotive, Building & Construction, Electrical & Electronics, Food & Household, Mechanical/Industrial, Medical & Healthcare and Others in Metric Tons ......... 274 Chart 222: Glance at 2012, 2017 and 2022 Asia-Pacific Sulfone Polymers Volume Market Share (%) by End-use Sector – Aerospace & Military, Automotive, Building & Construction, Electrical & Electronics, Food & Household, Mechanical/Industrial, Medical & Healthcare and Others ... 275 Value Analysis ........................................................ 276 Chart 223: Asia-Pacific Sulfone Polymers Market Analysis (2012-2022) by End-use Sector – Aerospace & Military, Automotive, Building & Construction, Electrical & Electronics, Food & Household, Mechanical/Industrial, Medical & Healthcare and Others in USD Million .......... 276 Chart 224: Glance at 2012, 2017 and 2022 Asia-Pacific Sulfone Polymers Value Market Share (%) by End-use Sector – Aerospace & Military, Automotive, Building & Construction, Electrical & Electronics, Food & Household, Mechanical/Industrial, Medical & Healthcare and Others ... 277 3.3 Asia-Pacific Sulfone Polymers Market Overview by Polymer Type ......................................................... 278 Volume Analysis..................................................... 278 Chart 225: Asia-Pacific Sulfone Polymers Market Analysis (2012-2022) by Polymer Type – Polysulfone (PSU), Polyphenylsulfone (PPSU) and Polyethersulfone (PESU) in Metric Tons ................................................................... 278 Chart 226: Glance at 2012, 2017 and 2022 Asia-Pacific Sulfone Polymers Volume Market Share (%) by Polymer Type – Polysulfone (PSU), Polyphenylsulfone (PPSU) and Polyethersulfone (PESU) ............................................... 279 Value Analysis ........................................................ 280 Chart 227: Asia-Pacific Sulfone Polymers Market Analysis (2012-2022) by Polymer Type – Polysulfone (PSU), Polyphenylsulfone (PPSU) and Polyethersulfone (PESU) in USD Million ................................................................... 280 Click here to buy the report Page 8
Sulfone Polymers (PSU, PPSU & PESU) – A Global Market Overview August 2016 |400 Pages | 342 Charts | Price $4500 Chart 244: Glance at 2012, 2017 and 2022 Asia-Pacific Polysulfone (PSU) & Polyphenylsulfone (PPSU) Value Market Share (%) by End-use Sector – Aerospace & Military, Automotive, Building & Construction, Electrical & Electronics, Food & Household, Mechanical/Industrial, Medical & Healthcare and Others ................................. 297 3.3.2.2 Polyethersulfone (PESU) ............................ 298 Volume Analysis ..................................................... 298 Chart 245: Asia-Pacific Polyethersulfone (PESU) Market Analysis (2012-2022) by End-use Sector – Aerospace & Military, Automotive, Electrical & Electronics, Food & Household, Mechanical/Industrial, Medical & Healthcare and Others in Metric Tons ............................................. 298 Chart 246: Glance at 2012, 2017 and 2022 Asia-Pacific Polyethersulfone (PESU) Volume Market Share (%) by End- use Sector – Aerospace & Military, Automotive, Electrical & Electronics, Food & Household, Mechanical/Industrial, Medical & Healthcare and Others ................................. 299 Value Analysis ........................................................ 300 Chart 247: Asia-Pacific Polyethersulfone (PESU) Market Analysis (2012-2022) by End-use Sector – Aerospace & Military, Automotive, Electrical & Electronics, Food & Household, Mechanical/Industrial, Medical & Healthcare and Others in USD Million ............................................. 300 Chart 248: Glance at 2012, 2017 and 2022 Asia-Pacific Polyethersulfone (PESU) Value Market Share (%) by End- use Sector – Aerospace & Military, Automotive, Electrical & Electronics, Food & Household, Mechanical/Industrial, Medical & Healthcare and Others ................................. 301 3.4 Asia-Pacific Sulfone Polymers Market Overview by Country .................................................................. 302 3.4.1 China ......................................................... 302 Chart 249: Chinese Sulfone Polymers Market Analysis (2012- 2022) in Volume (Metric Tons) and Value (USD Million) ...... 302 3.4.1.1 Chinese Sulfone Polymers Market Overview by End-use Sector .................................................. 303 Volume Analysis ..................................................... 303 Chart 250: Chinese Sulfone Polymers Market Analysis (2012-2022) by End-use Sector – Aerospace & Military, Automotive, Building & Construction, Electrical & Electronics, Food & Household, Mechanical/Industrial, Medical & Healthcare and Others in Metric Tons .......... 303 Chart 251: Glance at 2012, 2017 and 2022 Chinese Sulfone Polymers Volume Market Share (%) by End-use Sector – Aerospace & Military, Automotive, Building & Construction, Electrical & Electronics, Food & Household, Mechanical/Industrial, Medical & Healthcare and Others ... 304 Value Analysis ........................................................ 305 Chart 252: Chinese Sulfone Polymers Market Analysis (2012-2022) by End-use Sector – Aerospace & Military, Automotive, Building & Construction, Electrical & Electronics, Food & Household, Mechanical/Industrial, Medical & Healthcare and Others in USD Million .......... 305 Chart 253: Glance at 2012, 2017 and 2022 Chinese Sulfone Polymers Value Market Share (%) by End-use Sector – Aerospace & Military, Automotive, Building & Construction, Electrical & Electronics, Food & Household, Mechanical/Industrial, Medical & Healthcare and Others ... 306 3.4.1.2 Chinese Sulfone Polymers Market Overview by Polymer Type .................................................... 307 Volume Analysis ..................................................... 307 Chart 254: Chinese Sulfone Polymers Market Analysis (2012- 2022) by Polymer Type – Polysulfone (PSU), Polyphenylsulfone (PPSU) and Polyethersulfone (PESU) in Metric Tons ............. 307 Chart 255: Glance at 2012, 2017 and 2022 Chinese Sulfone Polymers Volume Market Share (%) by Polymer Type – Polysulfone (PSU), Polyphenylsulfone (PPSU) and Polyethersulfone (PESU) ................................................ 308 Value Analysis ........................................................ 309 Chart 256: Chinese Sulfone Polymers Market Analysis (2012-2022) by Polymer Type – Polysulfone (PSU), Polyphenylsulfone (PPSU) and Polyethersulfone (PESU) in USD Million ................................................................... 309 Chart 257: Glance at 2012, 2017 and 2022 Chinese Sulfone Polymers Value Market Share (%) by Polymer Type – Polysulfone (PSU), Polyphenylsulfone (PPSU) and Polyethersulfone (PESU) ................................................ 310 3.4.1.2.1 Chinese Sulfone Polymers Product Type Market Overview by End-use Sector ..................... 311 3.4.1.2.1.1 Polysulfone (PSU) & Polyphenylsulfone (PPSU) .................................................................... 311 Volume Analysis..................................................... 311 Chart 258: Chinese Polysulfone (PSU) & Polyphenylsulfone (PPSU) Market Analysis (2012-2022) by End-use Sector – Aerospace & Military, Automotive, Building & Construction, Electrical & Electronics, Food & Household, Mechanical/Industrial, Medical & Healthcare and Others in Metric Tons ............................................................... 311 Chart 259: Glance at 2012, 2017 and 2022 Chinese Polysulfone (PSU) & Polyphenylsulfone (PPSU) Volume Market Share (%) by End-use Sector – Aerospace & Military, Automotive, Building & Construction, Electrical & Electronics, Food & Household, Mechanical/Industrial, Medical & Healthcare and Others ................................. 312 Value Analysis ........................................................ 313 Chart 260: Chinese Polysulfone (PSU) & Polyphenylsulfone (PPSU) Market Analysis (2012-2022) by End-use Sector – Aerospace & Military, Automotive, Building & Construction, Electrical & Electronics, Food & Household, Mechanical/Industrial, Medical & Healthcare and Others in USD Million ............................................................... 313 Chart 261: Glance at 2012, 2017 and 2022 Chinese Polysulfone (PSU) & Polyphenylsulfone (PPSU) Value Market Share (%) by End-use Sector – Aerospace & Military, Automotive, Building & Construction, Electrical & Electronics, Food & Household, Mechanical/Industrial, Medical & Healthcare and Others ................................. 314 3.4.1.2.1.2 Polyethersulfone (PESU) ...................... 315 Volume Analysis..................................................... 315 Chart 262: Chinese Polyethersulfone (PESU) Market Analysis (2012-2022) by End-use Sector – Aerospace & Military, Automotive, Electrical & Electronics, Food & Household, Mechanical/Industrial, Medical & Healthcare and Others in Metric Tons ............................................ 315 Chart 263: Glance at 2012, 2017 and 2022 Chinese Polyethersulfone (PESU) Volume Market Share (%) by End- use Sector - Aerospace & Military, Automotive, Electrical & Electronics, Food & Household, Mechanical/Industrial, Medical & Healthcare and Others ................................. 316 Value Analysis ........................................................ 317 Chart 264: Chinese Polyethersulfone (PESU) Market Analysis (2012-2022) by End-use Sector – Aerospace & Military, Automotive, Electrical & Electronics, Food & Household, Mechanical/Industrial, Medical & Healthcare and Others in USD Million ............................................. 317 Chart 265: Glance at 2012, 2017 and 2022 Chinese Polyethersulfone (PESU) Value Market Share (%) by End- use Sector – Aerospace & Military, Automotive, Electrical & Electronics, Food & Household, Mechanical/Industrial, Medical & Healthcare and Others ................................. 318 3.4.2.2 Indian Sulfone Polymers Market Overview by Polymer Type ......................................................... 324 Chart 271: Indian Sulfone Polymers Market Analysis (2012- 2022) by Polymer Type – Polysulfone (PSU), Polyphenylsulfone (PPSU) and Polyethersulfone (PESU) in Metric Tons .................................................................. 324 Chart 272: Glance at 2012, 2017 and 2022 Indian Sulfone Polymers Volume Market Share (%) by Polymer Type – Polysulfone (PSU), Polyphenylsulfone (PPSU) and Polyethersulfone (PESU) ............................................... 325 Value Analysis ........................................................ 326 Chart 273: Indian Sulfone Polymers Market Analysis (2012- 2022) by Polymer Type – Polysulfone (PSU), Polyphenylsulfone (PPSU) and Polyethersulfone (PESU) in USD Million ............. 326 Chart 274: Glance at 2012, 2017 and 2022 Indian Sulfone Polymers Value Market Share (%) by Polymer Type – Polysulfone (PSU), Polyphenylsulfone (PPSU) and Polyethersulfone (PESU) ............................................... 327 3.4.3 Japan ......................................................... 328 Chart 275: Japanese Sulfone Polymers Market Analysis (2012- 2022) in Volume (Metric Tons) and Value (USD Million) ...... 328 3.4.3.1 Japanese Sulfone Polymers Market Overview by End-use Sector .................................................. 329 Volume Analysis .................................................... 329 Chart 276: Japanese Sulfone Polymers Market Analysis (2012-2022) by End-use Sector – Aerospace & Military, Automotive, Building & Construction, Electrical & Electronics, Food & Household, Mechanical/Industrial, Medical & Healthcare and Others in Metric Tons ......... 329 Chart 277: Glance at 2012, 2017 and 2022 Japanese Sulfone Polymers Volume Market Share (%) by End-use Sector – Aerospace & Military, Automotive, Building & Construction, Electrical & Electronics, Food & Household, Mechanical/Industrial, Medical & Healthcare and Others ... 330 Value Analysis ........................................................ 331 Chart 278: Japanese Sulfone Polymers Market Analysis (2012-2022) by End-use Sector – Aerospace & Military, Automotive, Building & Construction, Electrical & Electronics, Food & Household, Mechanical/Industrial, Medical & Healthcare and Others in USD Million ......... 331 Chart 279: Glance at 2012, 2017 and 2022 Japanese Sulfone Polymers Value Market Share (%) by End-use Sector – Aerospace & Military, Automotive, Building & Construction, Electrical & Electronics, Food & Household, Mechanical/Industrial, Medical & Healthcare and Others ... 332 3.4.3.2 Japanese Sulfone Polymers Market Overview by Polymer Type .................................................... 333 Volume Analysis .................................................... 333 Chart 280: Japanese Sulfone Polymers Market Analysis (2012-2022) by Polymer Type – Polysulfone (PSU), Polyphenylsulfone (PPSU) and Polyethersulfone (PESU) in Metric Tons .................................................................. 333 Chart 281: Glance at 2012, 2017 and 2022 Japanese Sulfone Polymers Volume Market Share (%) by Polymer Type – Polysulfone (PSU), Polyphenylsulfone (PPSU) and Polyethersulfone (PESU) ............................................... 334 Value Analysis ........................................................ 335 Chart 282: Japanese Sulfone Polymers Market Analysis (2012-2022) by Polymer Type – Polysulfone (PSU), Polyphenylsulfone (PPSU) and Polyethersulfone (PESU) in USD Million ................................................................... 335 Chart 283: Glance at 2012, 2017 and 2022 Japanese Sulfone Polymers Value Market Share (%) by Polymer Type – Polysulfone (PSU), Polyphenylsulfone (PPSU) and Polyethersulfone (PESU) .................................................... 336 3.4.3.2.1 Japanese Sulfone Polymers Product Type Market Overview by End-use Sector ..................... 337 3.4.3.2.1.1 Polysulfone (PSU) & Polyphenylsulfone (PPSU) .................................................................... 337 Volume Analysis .................................................... 337 Chart 284: Japanese Polysulfone (PSU) & Polyphenylsulfone (PPSU) Market Analysis (2012-2022) by End-use Sector – Aerospace & Military, Automotive, Building & Construction, Electrical & Electronics, Food & Household, Mechanical/Industrial, Medical & Healthcare and Others in Metric Tons ............................................ 337 3.4.2 India .......................................................... 319 Chart 266: Indian Sulfone Polymers Market Analysis (2012- 2022) in Volume (Metric Tons) and Value (USD Million) .. 319 3.4.2.1 Indian Sulfone Polymers Market Overview by End-use Sector ....................................................... 320 Volume Analysis..................................................... 320 Chart 267: Indian Sulfone Polymers Market Analysis (2012- 2022) by End-use Sector – Automotive, Electrical & Electronics, Mechanical/Industrial, Medical & Healthcare and Others in Metric Tons ............................................ 320 Chart 268: Glance at 2012, 2017 and 2022 Indian Sulfone Polymers Volume Market Share (%) by End-use Sector – Automotive, Electrical & Electronics, Mechanical/Industrial, Medical & Healthcare and Others ..................................... 321 Value Analysis ........................................................ 322 Chart 269: Indian Sulfone Polymers Market Analysis (2012- 2022) by End-use Sector – Automotive, Electrical & Electronics, Mechanical/Industrial, Medical & Healthcare and Others in USD Million ............................................. 322 Chart 270: Glance at 2012, 2017 and 2022 Indian Sulfone Polymers Value Market Share (%) by End-use Sector – Automotive, Electrical & Electronics, Mechanical/Industrial, Medical & Healthcare and Others ..................................... 323 Click here to buy the report Page 9
Sulfone Polymers (PSU, PPSU & PESU) – A Global Market Overview August 2016 |400 Pages | 342 Charts | Price $4500 Chart 285: Glance at 2012, 2017 and 2022 Japanese Polysulfone (PSU) & Polyphenylsulfone (PPSU) Volume Market Share (%) by End-use Sector – Aerospace & Military, Automotive, Building & Construction, Electrical & Electronics, Food & Household, Mechanical/Industrial, Medical & Healthcare and Others ................................. 338 Value Analysis ........................................................ 339 Chart 286: Japanese Polysulfone (PSU) & Polyphenylsulfone (PPSU) Market Analysis (2012-2022) by End-use Sector – Aerospace & Military, Automotive, Building & Construction, Electrical & Electronics, Food & Household, Mechanical/Industrial, Medical & Healthcare and Others in USD Million ............................................. 339 Chart 287: Glance at 2012, 2017 and 2022 Japanese Polysulfone (PSU) & Polyphenylsulfone (PPSU) Value Market Share (%) by End-use Sector – Aerospace & Military, Automotive, Building & Construction, Electrical & Electronics, Food & Household, Mechanical/Industrial, Medical & Healthcare and Others ................................. 340 3.4.3.2.1.2 Polyethersulfone (PESU) ...................... 341 Volume Analysis ..................................................... 341 Chart 288: Japanese Polyethersulfone (PESU) Market Analysis (2012-2022) by End-use Sector – Aerospace & Military, Automotive, Electrical & Electronics, Food & Household, Mechanical/Industrial, Medical & Healthcare and Others in Metric Tons ............................................. 341 Chart 289: Glance at 2012, 2017 and 2022 Japanese Polyethersulfone (PESU) Volume Market Share (%) by End- use Sector – Aerospace & Military, Automotive, Electrical & Electronics, Food & Household, Mechanical/Industrial, Medical & Healthcare and Others ................................. 342 Value Analysis ........................................................ 343 Chart 290: Japanese Polyethersulfone (PESU) Market Analysis (2012-2022) by End-use Sector – Aerospace & Military, Automotive, Electrical & Electronics, Food & Household, Mechanical/Industrial, Medical & Healthcare and Others in USD Million ............................................. 343 Chart 291: Glance at 2012, 2017 and 2022 Japanese Polyethersulfone (PESU) Value Market Share (%) by End- use Sector – Aerospace & Military, Automotive, Electrical & Electronics, Food & Household, Mechanical/Industrial, Medical & Healthcare and Others ................................. 344 3.4.4 South Korea ............................................... 345 Chart 292: South Korean Sulfone Polymers Market Analysis (2012-2022) in Volume (Metric Tons) and Value (USD Million) ................................................................. 345 3.4.4.1 South Korean Sulfone Polymers Market Overview by End-use Sector .................................. 346 Volume Analysis ..................................................... 346 Chart 293: South Korean Sulfone Polymers Market Analysis (2012-2022) by End-use Sector – Automotive, Electrical & Electronics, Food & Household, Mechanical/Industrial, Medical & Healthcare and Others in Metric Tons ............................................................... 346 Chart 294: Glance at 2012, 2017 and 2022 South Korean Sulfone Polymers Volume Market Share (%) by End-use Sector – Automotive, Electrical & Electronics, Food & Household, Mechanical/Industrial, Medical & Healthcare and Others .................................................................... 347 Value Analysis ........................................................ 348 Chart 295: South Korean Sulfone Polymers Market Analysis (2012-2022) by End-use Sector – Automotive, Electrical & Electronics, Food & Household, Mechanical/Industrial, Medical & Healthcare and Others in USD Million ................................................................ 348 Chart 296: Glance at 2012, 2017 and 2022 South Korean Sulfone Polymers Value Market Share (%) by End-use Sector – Automotive, Electrical & Electronics, Food & Household, Mechanical/Industrial, Medical & Healthcare and Others .................................................................... 349 3.4.4.2 South Korean Sulfone Polymers Market Overview by Polymer Type .................................... 350 Volume Analysis ..................................................... 350 Chart 297: South Korean Sulfone Polymers Market Analysis (2012-2022) by Polymer Type – Polysulfone (PSU), Polyphenylsulfone (PPSU) and Polyethersulfone (PESU) in Metric Tons ................................................................... 350 Chart 298: Glance at 2012, 2017 and 2022 South Korean Sulfone Polymers Volume Market Share (%) by Polymer Type – Polysulfone (PSU), Polyphenylsulfone (PPSU) and Polyethersulfone (PESU) ............................................... 351 Value Analysis ........................................................ 352 Chart 299: South Korean Sulfone Polymers Market Analysis (2012-2022) by Polymer Type – Polysulfone (PSU), Polyphenylsulfone (PPSU) and Polyethersulfone (PESU) in USD Million ................................................................... 352 Chart 300: Glance at 2012, 2017 and 2022 South Korean Sulfone Polymers Value Market Share (%) by Polymer Type – Polysulfone (PSU), Polyphenylsulfone (PPSU) and Polyethersulfone (PESU) ............................................... 353 3.4.4.2.1 South Korean Sulfone Polymers Product Type Market Overview by End-use Sector ............. 354 3.4.4.2.1.1 Polysulfone (PSU) & Polyphenylsulfone (PPSU) .................................................................... 354 Volume Analysis..................................................... 354 Chart 301: South Korean Polysulfone (PSU) & Polyphenylsulfone (PPSU) Market Analysis (2012-2022) by End-use Sector – Automotive, Electrical & Electronics, Food & Household, Mechanical/Industrial, Medical & Healthcare and Others in Metric Tons .......................... 354 Chart 302: Glance at 2012, 2017 and 2022 South Korean Polysulfone (PSU) & Polyphenylsulfone (PPSU) Volume Market Share (%) by End-use Sector – Automotive, Electrical & Electronics, Food & Household, Mechanical/Industrial, Medical & Healthcare and Others ... 355 Value Analysis ........................................................ 356 Chart 303: South Korean Polysulfone (PSU) & Polyphenylsulfone (PPSU) Market Analysis (2012-2022) by End-use Sector – Automotive, Electrical & Electronics, Food & Household, Mechanical/Industrial, Medical & Healthcare and Others in USD Million ........................... 356 Chart 304: Glance at 2012, 2017 and 2022 South Korean Polysulfone (PSU) & Polyphenylsulfone (PPSU) Value Market Share (%) by End-use Sector – Automotive, Electrical & Electronics, Food & Household, Mechanical/Industrial, Medical & Healthcare and Others ... 357 3.4.4.2.1.2 Polyethersulfone (PESU) ...................... 358 Volume Analysis..................................................... 358 Chart 305: South Korean Polyethersulfone (PESU) Market Analysis (2012-2022) by End-use Sector – Automotive, Electrical & Electronics, Food & Household, Mechanical/Industrial, Medical & Healthcare and Others in Metric Tons ............................................................... 358 Chart 306: Glance at 2012, 2017 and 2022 South Korean Polyethersulfone (PESU) Volume Market Share (%) by End- use Sector – Automotive, Electrical & Electronics, Food & Household, Mechanical/Industrial, Medical & Healthcare and Others .................................................................... 359 Value Analysis ........................................................ 360 Chart 307: South Korean Polyethersulfone (PESU) Market Analysis (2012-2022) by End-use Sector – Automotive, Electrical & Electronics, Food & Household, Mechanical/Industrial, Medical & Healthcare and Others in USD Million ............................................................... 360 Chart 308: Glance at 2012, 2017 and 2022 South Korean Polyethersulfone (PESU) Value Market Share (%) by End- use Sector – Automotive, Electrical & Electronics, Food & Household, Mechanical/Industrial, Medical & Healthcare and Others .................................................................... 361 3.4.5 Rest of Asia-Pacific ..................................... 362 Chart 309: Rest of APAC Sulfone Polymers Market Analysis (2012- 2022) in Volume (Metric Tons) and Value (USD Million) .......... 362 3.4.5.1 Rest of Asia-Pacific Sulfone Polymers Market Overview by End-use Sector .................................. 363 Volume Analysis..................................................... 363 Chart 310: Rest of APAC Sulfone Polymers Market Analysis (2012-2022) by End-use Sector – Automotive, Electrical & Electronics, Food & Household, Mechanical/Industrial, Medical & Healthcare and Others in Metric Tons ......... 363 Chart 311: Glance at 2012, 2017 and 2022 Rest of APAC Sulfone Polymers Volume Market Share (%) by End-use Sector – Automotive, Electrical & Electronics, Food & Household, Mechanical/Industrial, Medical & Healthcare and Others .................................................................... 364 Value Analysis ........................................................ 365 Chart 312: Rest of APAC Sulfone Polymers Market Analysis (2012-2022) by End-use Sector – Automotive, Electrical & Electronics, Food & Household, Mechanical/Industrial, Medical & Healthcare and Others in USD Million ......... 365 Chart 313: Glance at 2012, 2017 and 2022 Rest of APAC Sulfone Polymers Value Market Share (%) by End-use Sector – Automotive, Electrical & Electronics, Food & Household, Mechanical/Industrial, Medical & Healthcare and Others ... 366 3.4.5.2 Rest of Asia-Pacific Sulfone Polymers Market Overview by Polymer Type .................................... 367 Volume Analysis .................................................... 367 Chart 314: Rest of APAC Sulfone Polymers Market Analysis (2012-2022) by Polymer Type – Polysulfone (PSU), Polyphenylsulfone (PPSU) and Polyethersulfone (PESU) in Metric Tons .................................................................. 367 Chart 315: Glance at 2012, 2017 and 2022 Rest of APAC Sulfone Polymers Volume Market Share (%) by Polymer Type – Polysulfone (PSU), Polyphenylsulfone (PPSU) and Polyethersulfone (PESU) ............................................... 368 Value Analysis ........................................................ 369 Chart 316: Rest of APAC Sulfone Polymers Market Analysis (2012-2022) by Polymer Type – Polysulfone (PSU), Polyphenylsulfone (PPSU) and Polyethersulfone (PESU) in USD Million ................................................................... 369 Chart 317: Glance at 2012, 2017 and 2022 Rest of APAC Sulfone Polymers Value Market Share (%) by Polymer Type – Polysulfone (PSU), Polyphenylsulfone (PPSU) and Polyethersulfone (PESU) .................................................... 370 3.4.5.2.1 Rest of Asia-Pacific Sulfone Polymers Product Type Market Overview by End-use Sector 371 3.4.5.2.1.1 Polysulfone (PSU) & Polyphenylsulfone (PPSU) .................................................................... 371 Volume Analysis .................................................... 371 Chart 318: Rest of APAC Polysulfone (PSU) & Polyphenylsulfone (PPSU) Market Analysis (2012-2022) by End-use Sector – Automotive, Electrical & Electronics, Food & Household, Mechanical/Industrial, Medical & Healthcare and Others in Metric Tons .......................... 371 Chart 319: Glance at 2012, 2017 and 2022 Rest of APAC Polysulfone (PSU) & Polyphenylsulfone (PPSU) Volume Market Share (%) by End-use Sector – Automotive, Electrical & Electronics, Food & Household, Mechanical/Industrial, Medical & Healthcare and Others ... 372 Value Analysis ........................................................ 373 Chart 320: Rest of APAC Polysulfone (PSU) & Polyphenylsulfone (PPSU) Market Analysis (2012-2022) by End-use Sector – Automotive, Electrical & Electronics, Food & Household, Mechanical/Industrial, Medical & Healthcare and Others in USD Million .......................... 373 Chart 321: Glance at 2012, 2017 and 2022 Rest of APAC Polysulfone (PSU) & Polyphenylsulfone (PPSU) Value Market Share (%) by End-use Sector – Automotive, Electrical & Electronics, Food & Household, Mechanical/Industrial, Medical & Healthcare and Others ... 374 3.4.5.2.1.2 Polyethersulfone (PESU) ...................... 375 Volume Analysis .................................................... 375 Chart 322: Rest of APAC Polyethersulfone (PESU) Market Analysis (2012-2022) by End-use Sector – Automotive, Electrical & Electronics, Food & Household, Mechanical/Industrial, Medical & Healthcare and Others in Metric Tons .............................................................. 375 Chart 323: Glance at 2012, 2017 and 2022 Rest of APAC Polyethersulfone (PESU) Volume Market Share (%) by End- use Sector – Automotive, Electrical & Electronics, Food & Household, Mechanical/Industrial, Medical & Healthcare and Others .................................................................... 376 Value Analysis ........................................................ 377 Chart 324: Rest of APAC Polyethersulfone (PESU) Market Analysis (2012-2022) by End-use Sector – Automotive, Electrical & Electronics, Food & Household, Mechanical/Industrial, Medical & Healthcare and Others in USD Million ........................................ 377 Chart 325: Glance at 2012, 2017 and 2022 Rest of APAC Polyethersulfone (PESU) Value Market Share (%) by End- use Sector – Automotive, Electrical & Electronics, Food & Household, Mechanical/Industrial, Medical & Healthcare and Others .................................................................... 378 Click here to buy the report Page 10
Sulfone Polymers (PSU, PPSU & PESU) – A Global Market Overview August 2016 |400 Pages | 342 Charts | Price $4500 4. REST OF WORLD ............................................. 379 Chart 326: Rest of World Sulfone Polymers Market Analysis (2012-2022) in Volume (Metric Tons) and Value (USD Million) ................................................................. 379 4.1 Rest of World Sulfone Polymers Market Overview by End-use Sector .................................................. 380 Volume Analysis ..................................................... 380 Chart 327: Rest of World Sulfone Polymers Market Analysis (2012-2022) by End-use Sector – Automotive, Electrical & Electronics, Mechanical/Industrial, Medical & Healthcare and Others in Metric Tons ........................... 380 Chart 328: Glance at 2012, 2017 and 2022 Rest of World Sulfone Polymers Volume Market Share (%) by End-use Sector – Automotive, Electrical & Electronics, Mechanical/Industrial, Medical & Healthcare and Others ... 381 Value Analysis ........................................................ 382 Chart 329: Rest of World Sulfone Polymers Market Analysis (2012-2022) by End-use Sector – Automotive, Electrical & Electronics, Mechanical/Industrial, Medical & Healthcare and Others in USD Million ........................... 382 Chart 330: Glance at 2012, 2017 and 2022 Rest of World Sulfone Polymers Value Market Share (%) by End-use Sector – Automotive, Electrical & Electronics, Mechanical/Industrial, Medical & Healthcare and Others ... 383 4.2 Rest of World Sulfone Polymers Market Overview by Polymer Type .................................................... 384 Volume Analysis ..................................................... 384 Chart 331: Rest of World Sulfone Polymers Market Analysis (2012-2022) by Polymer Type – Polysulfone (PSU) and Polyethersulfone (PESU) in Metric Tons ................. 384 Chart 332: Glance at 2012, 2017 and 2022 Rest of World Sulfone Polymers Volume Market Share (%) by Polymer Type – Polysulfone (PSU) and Polyethersulfone (PESU) 385 Value Analysis ........................................................ 386 Chart 333: Rest of World Sulfone Polymers Market Analysis (2012-2022) by Polymer Type – Polysulfone (PSU) and Polyethersulfone (PESU) in USD Million ................. 386 Chart 334: Glance at 2012, 2017 and 2022 Rest of World Sulfone Polymers Value Market Share (%) by Polymer Type – Polysulfone (PSU) and Polyethersulfone (PESU) ......... 387 4.2.1 Rest of World Sulfone Polymers Product Type Market Overview by End-use Sector ..................... 388 4.2.1.1 Polysulfone (PSU) ....................................... 388 Volume Analysis..................................................... 388 Chart 335: Rest of World Polysulfone (PSU) Market Analysis (2012-2022) by End-use Sector – Automotive, Electrical & Electronics, Mechanical/Industrial, Medical & Healthcare and Others in Metric Tons .......................... 388 Chart 336: Glance at 2012, 2017 and 2022 Rest of World Polysulfone (PSU) Volume Market Share (%) by End-use Sector – Automotive, Electrical & Electronics, Mechanical/Industrial, Medical & Healthcare and Others ... 389 Value Analysis ........................................................ 390 Chart 337: Rest of World Polysulfone (PSU) Market Analysis (2012-2022) by End-use Sector – Automotive, Electrical & Electronics, Mechanical/Industrial, Medical & Healthcare and Others in USD Million ........................... 390 Chart 338: Glance at 2012, 2017 and 2022 Rest of World Polysulfone (PSU) Value Market Share (%) by End-use Sector – Automotive, Electrical & Electronics, Mechanical/Industrial, Medical & Healthcare and Others ... 391 4.2.1.2 Polyethersulfone (PESU) ............................ 392 Volume Analysis .................................................... 392 Chart 339: Rest of World Polyethersulfone (PESU) Market Analysis (2012-2022) by End-use Sector – Automotive, Electrical & Electronics, Mechanical/Industrial, Medical & Healthcare and Others in Metric Tons .......................... 392 Chart 340: Glance at 2012, 2017 and 2022 Rest of World Polyethersulfone (PESU) Volume Market Share (%) by End- use Sector – Automotive, Electrical & Electronics, Mechanical/Industrial, Medical & Healthcare and Others ... 393 Value Analysis ........................................................ 394 Chart 341: Rest of World Polyethersulfone (PESU) Market Analysis (2012-2022) by End-use Sector – Automotive, Electrical & Electronics, Mechanical/Industrial, Medical & Healthcare and Others in USD Million .......................... 394 Chart 342: Glance at 2012, 2017 and 2022 Rest of World Polyethersulfone (PESU) Value Market Share (%) by End- use Sector – Automotive, Electrical & Electronics, Mechanical/Industrial, Medical & Healthcare and Others ... 395 PART C: GUIDE TO THE INDUSTRY ............... 396 1. Sulfone Polymer Manufacturers ...................... 396 2. Independent Compounders and Processors ..... 396 PART D: ANNEXURE .................................... 399 1. RESEARCH METHODOLOGY ............................. 399 2. FEEDBACK ....................................................... 401 About Industry Experts Industry Experts values the most updated and accurate market research and industry analysis to provide unique market research reports for a broad range of industry verticals including Automotive, Transportation, Healthcare, Pharmaceuticals, Food & Beverages, Chemicals, Plastics, Materials, Consumer Goods, Retail, Biotechnology, Construction, Manufacturing and Other industries. Our research reports help our clients to identify and resolve topical issues by providing a complete picture of the market in their respective industry sectors. The Company’s rich collection of market research reports enable the companies to explore market drivers; forecast the future market; and to formulate the right strategies at the right time. INDUSTRY EXPERTS 1-7-19/C, Street No. 8, Habsiguda Hyderabad – 500007, India Phone: +91-40-4018-1314 Fax: +91-40-4027-2381 info@industry-experts.com industry-experts.com Industry Experts’ leading edge publications makes the life easy for corporate strategists, investors, analysts and researchers, start ups, consultants, financial and banking executives, academicians and many more. The company also provides customized research reports to cater the needs of the industry. More about Industry Experts Click here to buy the report Page 11