4 Chart Types Olymp Trade platform
60 likes | 84 Vues
4 Chart Types Olymp Trade platform<br><br>4 Chart Types you can use on the Olymp Trade platform<br><br>Chart types available on the Olymp Trade platform<br><br>4 Chart Types, Olymp Trade, platform, Olymp Trade platform

4 Chart Types Olymp Trade platform
E N D
Presentation Transcript
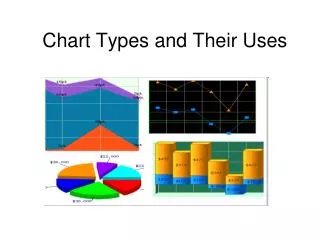
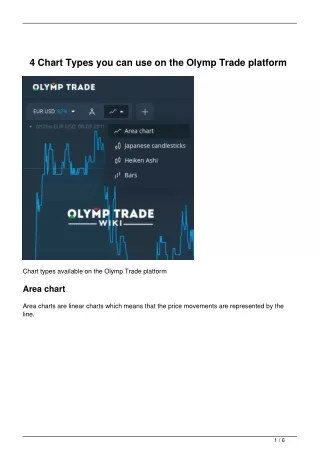
4 Chart Types you can use on the Olymp Trade platform Chart types available on the Olymp Trade platform Area chart Area charts are linear charts which means that the price movements are represented by the line. 1 / 6
Area chart at Olymp Trade Japanese candlesticks This particular type of chart is the most widely used nowadays. Candlesticks carry information about changes in the price over a specified time frame. The body and wicks form a candlestick. The body range tells us about the opening price (O) and the closing price (C). The wick on the top of the candle shows the highest price (H) and the one on the bottom indicates the lowest price (L). The candlestick is coloured green in case the price of the asset is going up. When it is going down, the candlestick will be red. A five-minute candlestick shows how the price is changing during a 5 minute period. 2 / 6
OHLC values on up and down candlesticks Bars The basic rules of their construction are the same as in the case of Japanese candlesticks. This chart type is formed by a vertical line and two short perpendicular lines to the left and to the right. The short lines give us the information about the opening and closing prices while a vertical line about the highest and the lowest ones. Bars contain the same set of price data but visually they are not so suggestive. 3 / 6
OHLC prices on a bar chart Heiken Ashi Another chart type available on Olymp Trade platform is Heiken Ashi. Take a look at the picture below and guess what it is. 4 / 6
Heiken Ashi chart If you are not familiar with Heiken Ashi and you will see the chart you will probably mistakenly guess that it is a candlestick chart. It actually looks like a candlestick chart. What can grasp your attention is the fact that there are usually more the same coloured candles in the row. In other words, the colour of the candles doesn't change that often like on the candlestick chart. The reason for that is Heiken Ashi candles are made not from pure prices (OHLC) but from calculations made using prices. All formulas used for calculating Heiken Ashi Candle are listed below. 5 / 6
Heiken Ashi calculations Why are Japanese Candlesticks the most commonly used? Candlesticks are the most popular chart type used to analyze today's market situation. Why do professionals like them so much? First of all, they are very easy to use. The other reason is the amount of the information they contain. They give a general overview of the situation and that is the reason they can be meaningful and useful without adding any indicators. Wish you only good choices! Read the original article at: https://www.olymptradewiki.com/chart-types-at-olymp-trade/ 6 / 6 Powered by TCPDF (www.tcpdf.org)