
Time-Lapse TIRF Imaging of Lipid Bilayers and PrP Oligomers Dynamics
This time-lapse movie illustrates the polarized Total Internal Reflection Fluorescence (TIRF) microscopy of supported bilayers composed of a 1:1:1 ratio of DOPC, DSPC, and cholesterol, labeled with the fluorescent probe DiI-C18. The imaging captures bright vesicles within a 30 µm x 30 µm area over 20 minutes at 20 frames per second after introducing PrP(106-126) oligomers at a concentration of 4.1 µM. The rapid polarization switch allows for simultaneous imagery, while the order parameter calculated for each frame provides insights into lipid organization dynamics.

Time-Lapse TIRF Imaging of Lipid Bilayers and PrP Oligomers Dynamics
E N D
Presentation Transcript
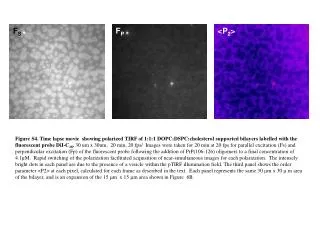
FS FP <P2> 5 µm Figure S4. Time lapse movie showing polarized TIRF of 1:1:1 DOPC:DSPC:cholesterol supported bilayers labelled with the fluorescent probe DiI-C18. 30 um x 30um, 20 min, 20 fps/ Images were taken for 20 min at 20 fps for parallel excitation (Fs) and perpendicular excitation (Fp) of the fluorescent probe following the addition of PrP(106-126) oligomers to a final concentration of 4.1µM. Rapid switching of the polarization facilitated acquisition of near-simultaneous images for each polarization. The intensely bright dots in each panel are due to the presence of a vesicle within the pTIRF illumination field. The third panel shows the order parameter <P2> at each pixel, calculated for each frame as described in the text. Each panel represents the same 30 m x 30 m area of the bilayer, and is an expansion of the 15 m x 15 m area shown in Figure 6B.