Download
1 / 19
190 likes | 307 Vues
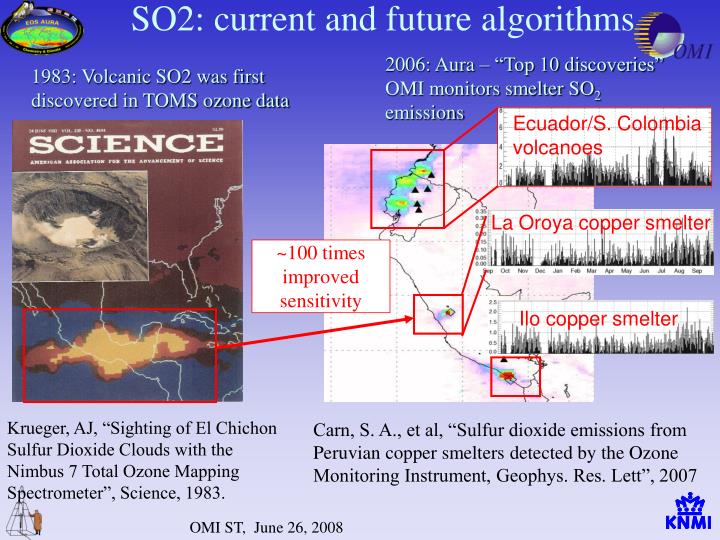
SO2: current and future algorithms. 2006: Aura – “Top 10 discoveries” OMI monitors smelter SO 2 emissions. 1983: Volcanic SO2 was first discovered in TOMS ozone data. Ecuador/S. Colombia volcanoes. La Oroya copper smelter. ~100 times improved sensitivity. Ilo copper smelter.

E N D
SO2: current and future algorithms 2006: Aura – “Top 10 discoveries” OMI monitors smelter SO2 emissions 1983: Volcanic SO2 was first discovered in TOMS ozone data Ecuador/S. Colombia volcanoes La Oroya copper smelter ~100 times improved sensitivity Ilo copper smelter Krueger, AJ, “Sighting of El Chichon Sulfur Dioxide Clouds with the Nimbus 7 Total Ozone Mapping Spectrometer”, Science, 1983. Carn, S. A., et al, “Sulfur dioxide emissions from Peruvian copper smelters detected by the Ozone Monitoring Instrument, Geophys. Res. Lett”, 2007
OMI BRD (pair) SO2 algorithm is used for anthropogenic sources An OMI SO2Band Residual Difference ( BRD) algorithm [Krotkov et al 2006] uses calibrated residuals at SO2 absorption band centers produced by the NASA operational ozone algorithm (OMTO3) [Bhartia and Wellemeyer 2002]
BRD algorithm fails with SO2 amounts >10 DU (ie. volcanic eruptions) Linear Fit (LF) algorithm developed for eruption amounts up to ~100 DU [Yang et al 2007 ] Cloud noise corrected by using OMI Rotational Raman cloud heights High volcanic amounts (~1000 DU) retrieved with off-line Iterative Spectral Fit (ISF) algorithm SO2plume height estimated with ISF [ Kai Yang – next presentation] - IMPORTANT APPLICATIONS OMI SO2 volcanic algorithms
Public OMSO2 algorithm uses V8.5 TOMS ozone and OMCLDRR data Four SO2 retrievals based on a-priori SO2 vertical profiles or center of mass altitude [CMA]: Planetary Boundary Layer (PBL): CMA = 0.9 km Lower tropospheric column (TRL): CMA = 2.5 km Mid-tropospheric column (TRM): CMA = 7.5 km UTLS column (STL): CMA = 17 km PBL data processed with BRD algorithm [Krotkov et al 2006] and require off-line AMF correction [ Krotkov et al 2008] Volcanic data (TRL, TRM and STL) are processed with LF algorithm [Yang et al 2007]. User should interpolate the 3 operational values assuming plume height or CMA Operational data: OMSO2 v1.1.1
AURA’s Ozone monitoring instrument (OMI) can detect smaller amounts of SO2 at higher spatial resolution than any previous satellite instrument OMI allows us to compare man-made SO2 emissions with natural sources (volcanoes) Norilsk Nickel Smelter Anatahan Volcano revising volcanic emissions Soufriere Hills Volcano Oil Refineries Next talk Coal Power Plants, China Sierra Negra Volcano Coal Power Plants, South Africa Ambrum Volcano Nyiragongo Volcano, DR Congo Designed by B. Schoeberl
Long-term SO2 burdens over USA, Europe and China East-Aire’05 experiment 25.5 million tons of SO2 was emitted by Chinese factories in 2005 up 27% from 2000
NOAA NESDIS NRT web site (George Serafino, Gilberto Vincente) BIRA/ISB support for aviation control service (SACS) NRT web site (Joss van Geffen) UMBC web site (Simon Carn, Arlin Krueger, Keith Evans ) definitive data for off-line analyses eruption tonnages composite SO2 cloud images composite ash cloud images Quick look public SO2 images
NOAA/NESDIS NRT Volcanic Websitehttp://satepsanone.nesdis.noaa.gov/pub/OMI/OMISO2/index.html
Less SO2 seen in May: evidence of reduced emissions before Olympics ?
Depth of Accumulated Snow, 01/29/08, 00 UTC, From CMA, cm Unusual snow accumulation in Jan-Feb 2008 This is MODIS region shown in next slides: Snow boundary
What are effects of snow, aerosols and clouds on OMI SO2 retrievals ?
MODIS channels 721 composite White – thick clouds; Blue - snow, no clouds Purple – no clouds, no snow Dark green – open water Snow boundary Thick cloud boundary
MODIS provides qualitative evidence of enhanced SO2 signal over snow Snow boundary MODIS provides qualitative evidence of SO2 screening by clouds Thick cloud boundary
Daily anthropogenic PBL data over China OMI SO2 burdens need cloud, aerosol and SO2 profile correction !! • Noise ~1.5DU for ideal conditions (near nadir view, no clouds). Only plumes from strong anthropogenic sources of SO2 (such as smelters and coal burning power plants) and from strong regional pollution can be detected in pixel data. • Operational SO2 data need off-line AMF correction for total ozone, SO2 profile, viewing geometry, clouds and aerosol effects [Krotkov et al 2008] – JGR Aura validation issue
SO2 Validation OMI SO2 Aerosol • AVDC - overpass data sets for ~100 power plants and Brewer locations; Need improvements in operational Brewer algorithm • New DOAS mini-spectrometers (PANDORA near pollution sources – Jay Herman & A. Cede, NOVAC near volcanoes– Bo Galle & S. Carn) • SO2 balloon (UMCP- R. Dickerson and UMCP student project; Gary Morris ) • In-situ aircraft (EAST-AIRE- China2005; TC4 South America 2007; China 2008) SO2
New Spectral Fit algorithm and volcanic SO2 height estimates (Kai Yang’ talk) Using mean SO2 profile shapes from CTM model for anthropogenic data Future enhancements: • Better aerosol and cloud correction using A-train data and improvements based on comparison with models and measurements. • algorithm improvements to account for changes in instrument performance • Transition to future instruments