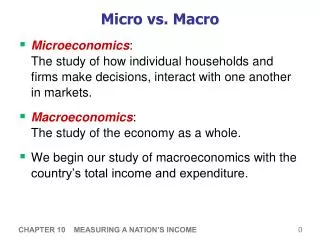
Research Skills in Academia: Nurturing Innovators for Future Contributions
This course aims to develop strong research skills for Ph.D. students, focusing on generating impactful research questions, familiarizing with empirical data sets, and translating ideas into research papers. Topics range from consumption inequality to small business understanding, with a focus on macroeconomic literatures. Co-taught by Sebastian and Steve, the class includes tasks such as paper extensions and virtual paper slides. Emphasis is placed on collaboration, skill enhancement, and preparing for the applied macro prelim. Students will engage in interactive discussions and practical activities to hone their research abilities.

Research Skills in Academia: Nurturing Innovators for Future Contributions
E N D
Presentation Transcript
Micro Data For Macro Models Fall 2011/Winter 2012 Topic 1: Consumption Inequality
1998 – 2000 Cohort That Are Tenured at Top Schools (with some omissions)
1998 – 2000 Cohort That Are Tenured at Top Schools (with some omissions)
Publishing? The median Ph.D. from a top 20 department never publishes anything in a peer reviewed journal The median peer reviewed article has less than 15 citations. See Dan Hamermesh’s web site for: “Young Economist’s Guide to Professional Etiquette” https://webspace.utexas.edu/hamermes/www/JEP92.pdf
The Good News The creation of research is a skill just like inverting a matrix, solving DSGE models, computing standard errors, etc. The more you work on it, the better you will become. Read the early work of those recently tenured at top schools. Every single one of you could have written the same papers! It is not only our technical prowess that distinguishes us throughout our careers, it is our ability to innovate and/or to come up with good questions. Those who have impact on the profession due so because of their ideas.
What Skill Are Ph.D. Students Most Deficient? Having the ability to identify interesting research questions The confusion of theoretical or empirical fire power as being an “end” as opposed to a “means”. Not having the ability to explain why anyone would care about their research.
Goal of This Class Get you to start thinking about writing your dissertation Familiarize you with many data sets that are used by macro economists (and others) to be used as part of your dissertation. Expose you to literatures within macroeconomics that have strong empirical components. Help you turn good research ideas into good research papers.
Some Housekeeping…. T.A.: Sebastian (with set up an email list for class participants including auditors) Lots of work – hopefully all of it useful o Homework o Paper extension o Virtual Paper Slides/Course Info Co-Taught with Steve Davis: Timing
Very Important If you are seeking take the prelim in the Applied Macro Sequence (this course plus the remaining courses), you must: 1) Complete a full version of your virtual paper in order to pass the portion of the course taught by us. 2) We will not offer questions on the prelim (although the faculty who teach the other parts of the sequence will). 3) You have to notify Steve and Erik by end of February if you are planning to take the applied macro prelim. We will give you feedback about our expectations for your paper. 4) You will still need to take the prelim with questions covering the remaining faculty (Harald, John Cochrane, Lars, etc.)
My Portion of the Course Topic 1: Consumption Inequality Topic 2: Lifecycle Consumption Topic 3: Home Production Topic 4: Long Run Trends in Labor Supply Topic 5: Unemployment During Recessions Topic 6: Regional Adjustments Topic 7: Occupational Choice Topic 8: Understanding Small Businesses
Steve’s Portion of the Class A few words from Steve…..
A Quick Detour: Research Questions in Real Time
What Drives The Time Series Patterns in Aggregate Savings Rates? • - Let’s brainstorm some explanations….. • 2. How Much of the Time Series Patterns of Aggregate Savings Can Be Explained by Various Factors (or at least one of the factors)? • Can We Use The Pre-2007 data to Predict Savings Behavior Going Forward? Potential Research Questions
Think Broadly – Lets not be constrained by actual data (yet) Potential Empirical Strategies?
What data exists? • o What data easily exists? What are the limitations of these data? • o What data conceivably exists? Now Lets Think About Existing Data
Why would someone care about the paper findings? • Note: • Too often, researchers (old and young alike) forget to answer this next question. An Important Next Step
Micro Expenditure Data: Household Surveys Consumer Expenditure Survey (U.S. data) Starts in 1980 Broad consumption measures Some income and demographic data Repeated cross-sections Panel Study of Income Dynamics (U.S. data) Starts in late 60s Only food expenditure consistently Housing/utilities (most of the time) Broader measures (recently) Very good income and demographics Panel nature
Micro Expenditure Data: Household Surveys British Household Panel (British Data) o Panel data including income and expenditure Family Expenditure Survey (British Data) Bank of Italy Survey of Household Income and Wealth (Italian Data) o Panel data including income and expenditure There are others….many Scandinavian countries, Japan, Canada, etc. Even some developing economies have detailed household surveys that track some measures of consumption (e.g., Mexico, Taiwan, Thailand)
Micro Expenditure Data: Scanner Data Nielsen Homescan Data o Large cross-section of households o Very detailed level transaction data (at the level of UPC code) o Some demographics o Some panel component o Matches quantities purchased with prices paid o Covers most of the large MSAs o Measurement error? o Selection? o Coverage of goods?
Micro Income Data: Household Surveys Current Population Survey (CPS) o Usual data set used within U.S. to track labor supply and earnings. o Has panel component. o Can be found at www.ipums.org/cps/ PSIDCan be found at http://psidonline.isr.umich.edu/ Survey of Income and Program Participation (SIPP) o Four year rotating panel o Large sample sizes o Over samples poor Census/American Community Survey o Can be found at www.ipums.org
Income and Consumption Inequality Large literature documenting the increase in income inequality within the U.S. during the last 30 years (Katz and Autor, 1999; Autor, Katz, Kearney, 2008) Consumption is a better measure of well being than income (utility is U(C) not U(Y)). Does income inequality imply consumption inequality? Depends on whether income inequality is “permanent” Depends on insurance mechanisms available to households Depends on other margins of substitution (home production, female labor supply, etc.).
Why Do We Care About Consumption Inequality? Why is it important? o Learn about well being over time (economic growth, standard of livings, inequality, etc.). o Learn about insurance mechanisms available to households (public insurance, private insurance, etc.)? o Learn about the nature of income processes (more on this in the next set of lecture notes).
Krueger and Perri (2006) What they do: o Use data from the Consumer Expenditure Survey (CEX) to track the evolution of consumption inequality. o CEX is includes a nationally representative sample of households. - Designed to compute consumption weights for CPI - Short panel dimension (4 quarters) - Mostly used as repeated cross sections. - Includes detailed spending measures on expenditures by categories. o Use repeated cross sections to track consumption inequality.
Krueger and Perri (2005): What They Conclude Conclusions o Income inequality is much greater than consumption inequality o If some of the increase in income inequality is idiosyncratic, households can self insure (or public sector can provide insurance) making consumption inequality respond less than income inequality. o Write down a model where insurance is endogenously provided. Increasing idiosyncratic shocks to income can increase demand for insurance (leading to more insurance). Consistent with their model, credit card access increased during this period. o Bottom line: Use the consumption data to learn about the nature of income processes and insurance mechanisms.
Can Measurement Error Alter Inequality Findings? Yes Depends on whether measurement error differs across the consumption (income) distribution. Suppose richer households have been underreporting their income to a greater extent in recent periods (relative to the past). The rich could be increasing their expenditure more (relative to other parts of the distribution). However, the systematic measurement error could also be increasing. How to test for group specific differences in measurement error?
Aguair and Bils (2011) Try to account for differential measurement error over different “income-demographic” groups to get a sense of changing consumption inequality. Some particulars: Define xijt = average expenditure on good j, by group i, at time t j goods = food at home, clothing, utilities, entertainment, etc. i groups = cells based on income (5) and demographics (18) DefineXit= average total expenditure for group i at time t. Formally:
The Essence of the Exercise (From a Discussion by Jonathan Parker; NBER EFG 2011) Log budget share of good: lnwi = ln (xi /X ) Inferred 2006 Observed 2006 Estimated Engel curve for luxury Observed 1980 Inferred adjustment to ln X90 Estimated Engel curve for normal good Log total real expenditure: X = xLux+xNormal+xNec ln X90 ln X90 ln X10 ln X90 ln X10
Aguair and Bils (2011) Assume measurement error in expenditure…… represents a good specific error (common across all groups) represents a group specific error (common across all goods)
Aguair and Bils (2011): Some Intuition Difference-in-Difference Estimates (2 good case, 2 group case) Goods = e (entertainment) and f(food) Groups = high (rich) and low (poor) (difference out good specific error) (difference out good specific error)
Aguair and Bils (2011): Some Intuition Take differences across goods to eliminate group specific error Obtain an unbiased estimate of relative consumption inequality. Need to map into units of total expenditure. Want to recover:
Aguair and Bils (2011) Suppose for true expenditures, x*: Can estimate the following using actual data in some period 0 where systematic measurement error is less of an issue: If there is no measurement error in the data, can uncover: Assumes income elasticities are constant over time (and can be locally estimated). Assume measurement error is zero in period 0.
Aguair and Bils (2011): Some Intuition Substituting in the estimated β’s, we get: