Download
1 / 52
520 likes | 670 Vues
Using Data to Measure Outcomes. Student Tracking and Using Data Effectively Geoff Zimmerman 2004 NTPN – Minneapolis, MN. Impact?. What impact are you having on the students and schools that you are serving?. Basic Question:. Goals for Today. Big Picture: Impact/Outcomes

E N D
Using Data to Measure Outcomes Student Tracking and Using Data Effectively Geoff Zimmerman 2004 NTPN – Minneapolis, MN
Impact? What impact are you having on the students and schools that you are serving? Basic Question:
Goals for Today • Big Picture: Impact/Outcomes • Nuts & Bolts: Data Collection • Tech Prep in Ohio: Measuring Success • Demonstration of Database Application • The Basics – Designing Your Own
Are you Data-Driven? In business and industry, data are king. Information about customers, inventory, sales, rates of return and employee turnover is crucial. Good data determines success or failure. = Educational Accountability
Why Collect Data? • Measure progress • Make program decisions • Perkins driven – shows accountability • Provides hard data to state executive and legislators when making funding decisions
No Child Left Behind Four Reform Principles Accountability: Guaranteeing Results Flexibility: Local Control for Local Challenges Research-Based Reforms: Proven Methods with Proven Results Parental Options: Choices for Parents, Hope for Kids
Perkins III • (1) Definition • Section 202(a)(3) of Perkins III states that a "tech-prep program" means a program of study that: • combines at a minimum 2 years of secondary education (as determined under State law) with a minimum of 2 years of postsecondary education in a nonduplicative, sequential course of study; • integrates academic, and vocational and technical, instruction, and utilize work-based and worksite learning where appropriate and available; • provides technical preparation in a career field such as engineering technology, applied science, a mechanical, industrial, or practical art or trade, agriculture, health occupations, business, or applied economics; • builds student competence in mathematics, science, reading, writing, communications, economics, and workplace skills through applied, contextual academics, and integrated instruction, in a coherent sequence of courses; • leads to an associate or a baccalaureate degree or a postsecondary certificate in a specific career field; and • leads to placement in appropriate employment or to further education. • An allowable tech prep program must meet the terms of this definition.
Are your programs making a difference? Beginning Questions • How many students are enrolled in a Tech Prep program? • What is the college transition rate for Tech Prep Students? How many are persisting in college? • What are the demographic characteristics of Tech Prep students? • To what extent are Tech Prep students prepared for college?
Measuring Outcomes • Why do you exist? • What conditions need to change for this target group and why? Describe your program – what does it do and what does it accomplish? Source: United Way of Greater St. Louis Guide for Measuring and Reporting Outcomes
Measuring Outcomes (cont.) • What is your program designed to do? • Who is the target of the change? Who benefits from your services? • What information do you need to compile about participants to ensure delivery? • What measurable changes will occur? Source: United Way of Greater St. Louis Guide for Measuring and Reporting Outcomes
Describing what you do Inputs – resources used to implement the program. Activities – actions that define what is done, when, where, how, how often, and for whom. Outputs – the direct products of the program activities. Measure of the amount and volume of work performed to implement the program. Source: United Way of Greater St. Louis Guide for Measuring and Reporting Outcomes
Describing your intended results Outcomes – the results the program aspires to accomplish; they specify immediate, intermediate, and long-term changes among students served by the program Indicators – measurable data about benefits for and changes in the target group that is collected at the individual level to show an outcome has been achieved Impact – what the program aspires to accomplish over a long period of time Source: United Way of Greater St. Louis Guide for Measuring and Reporting Outcomes
Outputs vs. Outcomes Output = what you do Outcome = what changes because of what you do -refining selections as a result of college fair or visitas opposed to x number of students attending the college fair -completing and submitting college applications following advising sessionas opposed to advising x number of students -submitting a FAFSA on timeas opposed to giving the FAFSA form to x number of students -persisting in college as opposed to enrolling in college
Logic Model Inputs Activities Outputs Outcomes Impact
Logic Model (alternative) Long-Term Impact Outcomes Outcomes Outcomes Activities Activities Activities
Uses of Outcome Information “A key element in effective use of outcome information is to continually ask why differences occur and then assess whether actions can be taken to improve results.” (p.15) Hatry, H., Morley, E., Rossman, S., and Wholey, J. (2003). How Federal Programs Use Outcome Information: Opportunities for Federal Managers. IBM Endowment for the Business of Government. Online: http://www.businessofgovernment.org/pdfs/HatryReport.pdf
In other words… • In other words outcome information • Tells us what is happening • So we can ask why it is happening • And fix it if it needs to be fixed • Celebrate it and tell everyone if it works
Uses of Outcome Information • How are you using it? • Triggering corrective action • Identifying and encouraging “best practices” • Motivating • Planning and Budgeting • Reporting to Key leaders *Hatry, et.al, How Federal Programs Use Outcome Information: Opportunities for Federal Managers
Quality is not just a chart, or a standard, or a specification—it’s a state of mind, a commitment, a responsibility, a spirit. It’s a way of doing, being, living. —Don Galer
“Insanity: the belief that one can get different results by doing the same thing.” -Albert Einstein
How to Collect? Primary Data Sources • Student enrollment form • Student list report of file from schools • Surveys – students, parents, teachers, etc. • Focus groups, interviews • Program site review process Secondary Data Sources U.S. Census Bureau, State Departments of Education, National Center for Education Statistics
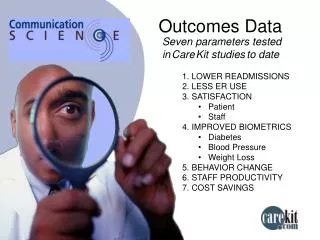
What to Collect • Determine what data to collect • Demographics • Participation in activities • College aspirations • Academic preparation • Persistence in college • Remediation in college • Feelings about the program • Perceptions of education and work
Survey Results Source: Greater Cincinnati Tech Prep Consortium, May 2004
Survey Results Source: Greater Cincinnati Tech Prep Consortium, May 2004
Survey Results Source: Greater Cincinnati Tech Prep Consortium, May 2004
Survey Results Source: Greater Cincinnati Tech Prep Consortium, May 2004
Survey Results Source: Greater Cincinnati Tech Prep Consortium, May 2004
Focus Group Results Source: Greater Cincinnati Tech Prep Consortium, September 2003
Educational Attainment, Bethel, Ohio QT-P20. Educational Attainment by Sex: 2000Data Set: Census 2000 Summary File 3 (SF 3) - Sample Data http://factfinder.census.gov
Ohio College Tech Prep combines college preparatory academics and advanced career-technical education into a seamless program from high school to college to high-skill, high-wage careers.
Innovative Local Delivery Models • CTP programs on college campuses • CTP programs in industry setting • Industry mentorships • Dual Enrollment and Transcripted college credit options • College faculty team-teaching with secondary instructors
College TP goals and Benchmarks • Ohio Tech Prep Goals (1998) • Expand CTP enrollment to meet Ohio’s critical workforce and economic needs • Provide a CTP system that reflects the requirements for success in college and in high-wage, high-skill technical careers. • Maximize student options through the integration of high school, associate degree and baccalaureate degree pathways to achieve a seamless, non-duplicative system. • Engage the active support and involvement of all College Tech Prep stakeholders. • Performance Benchmarks • Expand enrollment: 15% of all 11th and 12th graders • Enter college remediation free: 10% higher rate than traditional college population • Transition to college: 66% • Under-represented groups: 25% ➲ ➲ ➲ ➲
3. Building the Secondary Pipeline Annual Enrollment
Student Tracking and Analysis though HEI Ohio Board of Regents Higher Education Information (HEI)Student Tracking System
How is this done? • Ohio has a comprehensive postsecondary data collection system in place - Higher Education Information System (HEI) • Available to all public two & four year institutions. • Limited access to private colleges
How HEI Works • Tracks students by SSN • Follows student mobility in higher education. • Tracks by campus type • State Community College & Community Colleges • Technical Colleges • University Branch or Main Campuses • Reports on remediation levels and persistence
HEI Enrollment Data Submissions Tech Prep Consortium Tracking (TC) File Revised May 1, 2002 File Description: The Tech Prep Consortium Tracking (TC) File contains one record for each student enrolled in a Tech Prep consortium. Submission Schedule: The TC file can be submitted anytime throughout the year. Data Fields:
HEI Enrollment Data Submissions Tech Prep Consortium Tracking (TC) File Data Fields (continued):
Link to HEI – 16 digit code • Consortium identifier • Student identifier (ss#) • Program Code • Career Center Code (IRN) • Delivery Site Code (IRN) • High School Code (IRN) • Graduation Year (CNCI999990153Y11T0110514820065930065932004N)
Internal Data Tracking System • Student Enrollment Forms (paper filing) • Microsoft Excel, Lotus • Microsoft Access • College databases for transition enrollment, remediation
What Data are Gathered • Consulted and sought input from consortia directors on four major topics. • Tech Prep Completion • Remediation • Transition and Persistence • Underrepresented Populations
Improved Remediation Rates Tech Prep vs. Non-Tech Prep Remediation Rates (18-19 year olds) 21337 students total 1604 students total Population are 18-19 year old freshman enrolled at community / technical colleges or university branch campuses.
Remediation (cont.) Two – Year Campuses 2003-04 Four - Year Campuses 2003-04
Persistence First-time, Full-time, degree-seeking Undergraduate Students age 19 and under in Autumn Term. Number and percent persisting to Autumn of next year, by type (tech prep vs. non tech prep). Persisting includes enrollment at an Ohio public institution, or private institution if full-time and receiving a Student Choice Grant, or proprietary institution if receiving a Workforce Development Grant. Data as of 8/27/2003. * First Time Full Time Degree Seeking Undergraduates * First Time Full Time Degree Seeking Undergraduates
New Data to be Collected . . • Post-program Placement Annualized Full-Time* Salaries (in thousands) Associate Degree Graduates: Fourth Year Following Graduation by Discipline