Download

1 / 54
550 likes | 757 Vues
Four Pillars of effective Risk management. Session Leader: Randy Thompson, Ph.D. Thompson Consulting & Training Eagle, Idaho Co-presenter Leslie Hoffman LEH Consulting Group Albuquerque, New Mexico. Current Conditions. Slow economic growth Low loan demand from higher credit borrowers

E N D
Four Pillars of effective Risk management Session Leader: Randy Thompson, Ph.D. Thompson Consulting & Training Eagle, Idaho Co-presenter Leslie Hoffman LEH Consulting Group Albuquerque, New Mexico
Current Conditions • Slow economic growth • Low loan demand from higher credit borrowers • Decreasing loan to share • Decreasing interest income • Risk aversion
Lender Response • Competitive Environment • High demand from lenders for lowest risk loans • Desire to minimize loss exposure • Tighter underwriting standards
Effect on Lenders • Focus on A+ and A loans for minimum risk • Competition forcing rates lower • Results in declining yields from the loan portfolio
Examples and Impact • Can each organization quantify that the loans they are funding will cover all loan related costs and provide a adequate return? or… • Are they offering loan to simply attract a volume of unprofitable business?
Down-shock and Impact • We have been actively operating in the down shock environment for the past 3 years. • Base Interest Rates • June 2010 4.62% • June 20132.97% • Reduced rates are useful if demand is strong • If demand is stagnate, reduced rates simply reduce yield and income
Strategies to Improve Performance • Maintain current volume of prime grade loans • Add lower grades loans equal to 30%-35% of current volume • Average rate on non-prime loans 12% • Increase ALLL to account for increased risk
Impact on Earnings • Increased non-prime loans carries higher risk • Accommodate risk with higher allowance funding • Estimate of increased risk is 4% of balances annually • Subtract increased allowance from increased earnings to identify net earnings increase.
Applying this methodology and its tools, multiple lenders have turned their yields and income around:
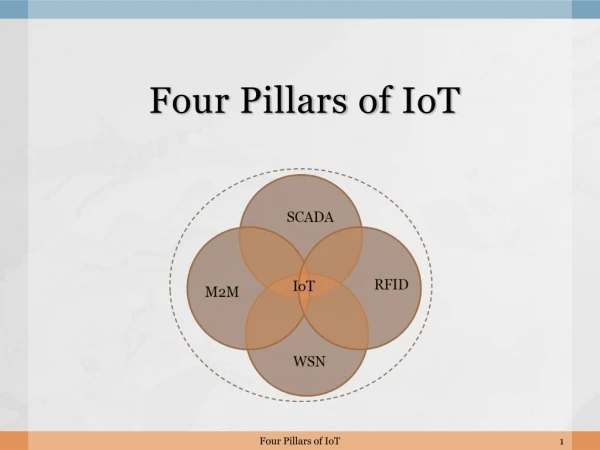
Four Pillars of Effective Risk Management • I: Credit Analysis • II: Empirically Derived Risk Based Pricing • III: Credit Monitoring • IV: Managing Repayment
Pillar I: Credit Analysis • Underwriting that takes into account the risk associated with the loan and the borrower • Identifies risk components to be considered in approving or denying the loan • Creates a loan package that manages risk and return
Pillar I: Credit Analysis • Comprehensive and consistently applied policies • Clarify acceptable loans • Specify the amounts in each grade • Specify terms • Specify maximum loan amounts • Specify minimum rate spreads
Pillar II: Empirically Derived Risk Based Pricing • Accounting for costs • Identifying replacement cost of money • Assuring an adequate margin/return • Regular model validation
Pillar II: Empirically Derived Risk Based Pricing • Account for all costs associated with loan programs • Measure and assign costs to each grade independently • Measure and assign replacement cost of money • Set rates and measure margins • Eliminate unprofitable rates and cross grade subsidies
Pillar II: Empirically Derived Risk Based Pricing • Accurate, Effective Pricing Requires: • Identification of core costs • Cost of Funds • Processing/Maintenance • Collections • Charge-offs • Identification of risk pools • Application of costs to pricing • Strategies to balance loan and share rates • Ongoing validation of the model
Perform Regular and Complete Cost Analyses 1. Cost of Funds • Lease payment for deposits • Average of payment for all deposits • Replacement cost over time 2. Processing/Maintenance • Contribution of staff time • Application of Operational Expenses • Distribution of Administration Costs
Perform Regular and Complete Cost Analyses 3. Collections • Examining collection expenses over time • Grouping by risk pool • Grouping by risk grade 4. Charge-offs • Examining charge-offs over time • Grouping by risk pool • Grouping by risk grade
Pillar II: Empirically Derived Risk Based Pricing • Assure all loan grades and types are contributing equitably • Measure returns/margins for pools and grades • Eliminate Cross-Grade Subsidies • Identify returns that are reducing over grades
Pillar II: Empirically Derived Risk Based Pricing • We can look at expanded options to address risk • Pricing for Risk Grade • Pricing for LTV • Pricing for Term
Pillar III: Credit Monitoring • Credit Migration of Impaired and Improved Loans • Net Credit Change • Ongoing Loan Decisioning
Credit Migration • Many names for the same concept • Credit migration • Multi-dimensional portfolio management • On-going decisioning • Migration Analysis
Credit Migration • No matter what name you use it is an important tool for managing the risk in your loan portfolio; • Examiners are asking for, and in some cases, requiring it; and • FASBE is currently examining changing guidance to focus on credit migration in allowance calculation
Credit Migration Definition: A measurement of changes in credit scores and risk for individual loans in the loan portfolio of the lending organization. The composite of these changes provides a valid measure of the current risk inherent in the total portfolio.
Understanding Credit Scores • Credit agencies continually monitor multiple risk indicators to calculate credit scores: • Payment history • Amount of credit • Available credit • Employment history • Repossessions • Bankruptcies • Foreclosures
Understanding Credit Scores • Each of these variables is dynamic • Changes in variables may change credit • Credit changes affect risk • Changes in risk may be an predicator of a member’s future performance
Pillar III: Credit Monitoring • Consistent Credit Migration Analysis • Original credit scores on current loans and balances • Recent credit scores on current loans and balances • Measure and identify impaired loans • Measure and identify improved loans • On-going Decisioning with impaired loans
Credit Migration Matrix-Portfolio • Create migration matrix for total portfolio • Original credit and current credit
Credit Migration Matrix-Pools • Create migration matrix for each risk pool
Credit Migration • Understanding your Loan Portfolio • Credit risk can Increase or Decrease • Which risk pools are improving impairing? • What is the net credit change for each pool?
Credit Scores and Loan Types • It is also important to partition loans by risk pools and apply the same analysis individually to each pool.
Net Credit Change • Create net credit change calculation
Credit Migration • Identifying Potential Problems • Isolate impaired loans and react to them early • Reduce Credit Limits • Freeze lines • Adjust rates • Understand the risk in your pools and adjust lending practices • Adjusting debt ratios • Adjusting LTVs • Other underwriting changes
Credit Migration • Why are deteriorating credit scores important to identify? • 70% to 80% of your charge-offs come from loans with deteriorating credit scores
Using Credit Scores to Manage Risk • How Can You Manage risk on an ongoing basis • Monitor changing risk scores and adjust: • Rates • Allowance • Credit limits • Limits on non-prime loans
More on Credit Migration • Identifying Emerging Opportunities • Recognize Members that are making smart decisions • Proactively offer ways to help your members • Understand which pools of loans to take on more risk • Applying Precision in Allowance Calculation • Statistically based calculation • Complying to regulations
Identifying Opportunities • Improving Credit scores are also important • Central mission of helping members • Targeted marketing • Increased loyalty • Upsell opportunities
Process of Credit Migration • Soft pull of credit scores/reports • Create migration matrix • Create net credit change calculation • Update portfolio analysis • Identify percentages of loans by grade • Update allowance • Perform individual loan analysis
Step 2: The Right Information • Are you pulling regular reports on the aging of your portfolio? • Look for movement between buckets • Are you tracking communication? • That log is a critical tool • Do you know how your client is performing with other creditors? • Pull a credit report
Using Credit Scores to Manage Risk • How Can You Manage risk on an ongoing basis • Monitor changing risk scores and adjust: • Rates • Allowance • Credit limits • Limits on non-prime loans
Step 3: Set Goals, Build a Schedule • Follow a schedule/protocol • That should start the first day of delinquency • Schedule activities • What are the best times to reach clients? • Set goals • No. of calls per day, week or month • Dollars collected per week or month or by staff member
Four Pillars of Effective Risk Management • I: Credit Analysis • II: Empirically Derived Risk Based Pricing • III: Credit Monitoring • IV: Managing Repayment
Monitoring Collection Success • List of delinquent loans were collected on a monthly • Included the account number for each loan, the balance of the loan, the days delinquent and any loan balances that had been charged off each month. • Loans were partitioned into five groups representing advanced delinquent loans, as measured by days delinquent.
Monitoring Collection Success • The breakout of loans for these groups was as follows: Group Days Delinquent 1 11-29 2 30-44 3 45-59 4 60-89 5 90+ • Charged off loans were labeled as group 9. • Non-delinquent loans were labeled as 0.