Comparing to CloudSat Cloud Profiles
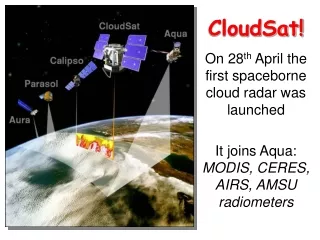
National Aeronautics and Space Administration. Comparing to CloudSat Cloud Profiles. Tutorial. www.nasa.gov. Website. Go to http://www.cloudsat.cira.colostate.edu/dpcstatusQL.php. Information. This website shows vertical profiles of the atmosphere taken by the CloudSat radar.

Comparing to CloudSat Cloud Profiles
E N D
Presentation Transcript
National Aeronautics and Space Administration Comparing toCloudSat Cloud Profiles Tutorial www.nasa.gov
Website • Go tohttp://www.cloudsat.cira.colostate.edu/dpcstatusQL.php
Information • This website shows vertical profiles of the atmosphere taken by the CloudSat radar. • After comparing your ground observation to Aqua satellite data, it can be useful to view these vertical cloud profiles to further explore the similarities and differences seen between your observation and the satellite’s reports. • The profiles on this website provide useful information on the vertical location of the clouds. The comparison of your ground data to the satellite’s data will assist in adjusting the satellite to attain more accurate information
Click on a granule for the date that you are comparing your data with. • A granule is one complete orbit of the satellite around the earth. Since the satellite orbits more than once a day, there are many granules for any day that you may wish to view. • If the satellite does not pass over your location on one granule, try another. The UTC can help you pick. It should match close to your observation Universal Time.
x = longitude y = latitude • This page shows the path of one granule. • It also shows the cloud and land profile of the entire granule. • The path is color-coded to match a specific part of the path to your location on the map. x = distance along orbit track y = altitude
Click on the number of the color that matches closest to your location. • The map then shows you the cloud and land profile that spans that section of the orbital path. This is the cloud profile above land This is the layout of the ground This is another view to show how the land, or in this case water, lays geographically
Interpreting the Image Cloudsat can even see through thick clouds But it cannot see dust or thin clouds
Warning • This is raw data and is not yet calibrated. The land profiling may appear to have “steps” and is not a smooth layout. • The satellite only views directly under its path of orbit, so your observations should match the best on days when the satellite passes almost directly overhead. You can determine these days from the detailed S’COOL overpass schedule you received through e-mail.
Overpass Schedule • A near-overhead satellite overpass
National Aeronautics and Space Administration Langley Research Center Hampton, VA 23681 www.nasa.gov