Download
1 / 14
140 likes | 365 Vues
Faraday Rotation of Gold Nanoparticles. By Christopher Ramirez Mentored Dr. Viktor Chikan Kansas State University Summer 2013 Research Experience for Undergraduates. Motivation. Faraday Rotation (FR): Metal NP exhibit enhanced FR

E N D
Faraday Rotation of Gold Nanoparticles By Christopher Ramirez Mentored Dr. Viktor Chikan Kansas State University Summer 2013 Research Experience for Undergraduates
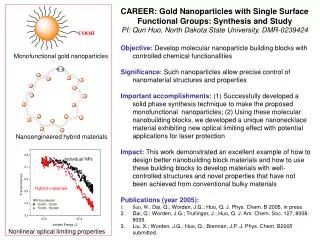
Motivation • Faraday Rotation (FR): • Metal NP exhibit enhanced FR • Applications such as optical isolators and phase modulators [1] • Observe FR signal dependence by varying NP size and concentration • Determine Verdet constant of gold using colloidal gold nanoparticles of varying concentrations and sizes
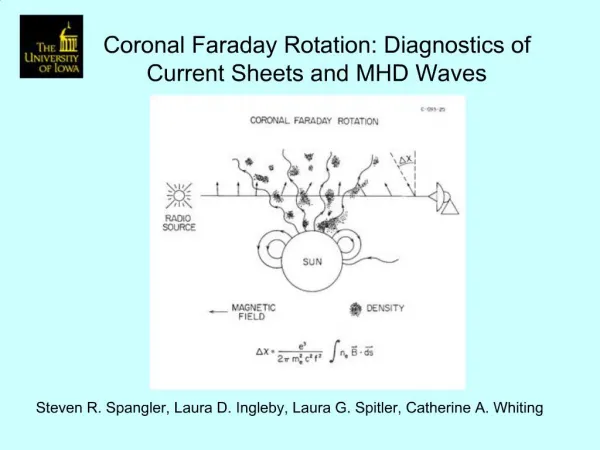
How Faraday Rotation Works kR kL • Linearly polarized • kL - left-circularly polarized EM vector • kR - right-circularly polarized EM vector • Equal in magnitude and phase dɸ kR • FR occurs results from phase difference • Birefringent material – index of refraction depends on propagation direction of light kL
SetupSchematic View I I x u z To spectrograph y v w Light source Linear polarizer Cell containing NP solution Solenoid Analyzer Light collector
MethodologyCCD Temperature Correction via Timing Calibration
Conclusion • FR signal for NP is concentration-dependent • As shown for 5nm and 10nm NP • FR signal increases linearly with magnetic field strength • Plasmon peaks are more pronounced and blueshifted as size increases • Verdet constant calculation may require more data
References [1] Chikan V.; Dani R. D.; Wysin, G. M.; Young, N. Effects of Interband Transitions on Faraday Rotation in Metallic Nanoparticles 2013 [2] Link, S.; El-Sayed, M. A. J. Phys. Chem. B 1999, 103, 4215