Supernova n detection with LVD
Supernova n detection with LVD. L arge V olume D etector @ LNGS. Marco Selvi – INFN Bologna,. 3 identical towers in the detector. 35 active modules in a tower. 8 counters in one module. LVD detector. Construction and data acquisition. Start construction and installation: 1990

Supernova n detection with LVD
E N D
Presentation Transcript
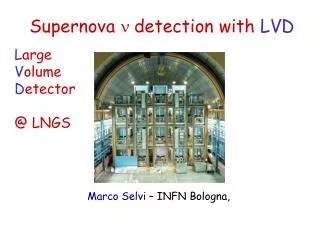
Supernova n detection with LVD Large Volume Detector @ LNGS Marco Selvi – INFN Bologna,
3 identical towers in the detector • 35 active modules in a tower • 8 counters in one module LVD detector
Construction and data acquisition • Start construction and installation: 1990 • First tower - Start data acquisition: june, 11th 1992 • Second tower – Start data acquisition : june, 1st 1994 • Third tower – Start data acquisition: december, 13th 2000 1 2 3 LVD is huge: 1000 tons of liquid scintillator and 2000 m2 of limited streamer tubes. LVD is highly modular: 840 independent counters
The detector: basic elements The scintillation counter: External dimensions: 1.5 x 1 x 1 m3 Scint. composition: CnH2n+2 <n>=9.6 +1 g/l PPO+ 0.03 g/l POPOP Scint. density: ~ 0.8 g/cm3 Attenuation lenght: > 15m @ l=420 nm Flash point at: ~39oC PMT: FEU-49B Photocathode diameter: d=15 cm Quantum efficiency: 10-15%
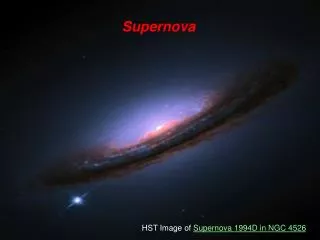
Main-sequence star Onion structure Helium-burning star Collapse (implosion) Hydrogen Burning Helium Burning Hydrogen Burning Stellar Collapse and Supernova Explosion Degenerate iron core: r 109 g cm-3 T 1010 K MFe 1.5 Msun RFe 8000 km
Newborn Neutron Star Collapse (implosion) Explosion ~ 50 km Neutrino Cooling Proto-Neutron Star r rnuc= 31014 g cm-3 T 30 MeV Stellar Collapse and Supernova Explosion
Newborn Neutron Star ~ 50 km Gravitational binding energy Eb 3 1053 erg 17% MSUN c2 This shows up as 99% Neutrinos 1% Kinetic energy of explosion (1% of this into cosmic rays) 0.01% Photons, outshine host galaxy Neutrino Cooling Neutrino luminosity Ln 3 1053 erg / 3 sec 3 1019LSUN While it lasts, outshines the entire visible universe Proto-Neutron Star r rnuc= 31014 g cm-3 T 30 MeV Stellar Collapse and Supernova Explosion
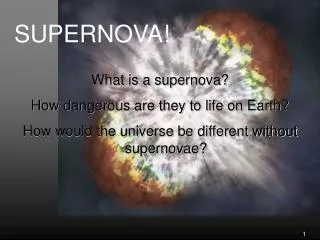
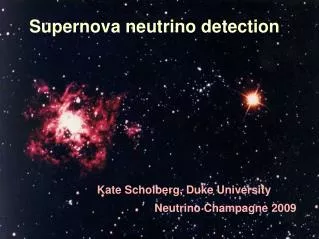
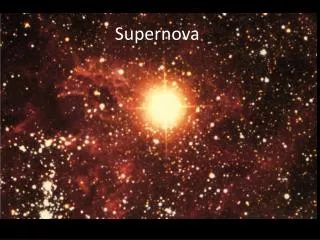
ne ne nmnm ntnt Main goal of the experiment Detection of neutrinos from a gravitational core collapse SN-II. 99% of the available energy (EB ~ 1053 erg) is released through the emission of neutrinos of all flavours One SN each 30-50 years is expected in our galaxy. Typical energy 0 - 100 MeV
SN n fluxes • The main features of then flux produced in the star are: • Neutrinos nahave a Fermi-Dirac energy spectrum, • Hierarchy of the temperatures:Tne< Tne< Tnx. • Approximate equipartition of energy among flavors: Lne Lne Lnx EB/6. • Typical parameters: • distance of D=10 kpc, • binding energy EB= 3 x 1053 erg, • perfect energy equipartition Lne= Lne = Lnx= EB/6. • assume identical fluxes nm nm nt nt (nx), • fix the ratio Tnx/Tne =1.5 , Tne/Tne =0.8 and Tne =5 MeV. Warning! Large uncertainties in the astrophysical parameters !!! Second warning ! It’s very difficult to consider rotation, magnetic fields and non spherical geometry in the MC simulations Third warning ! These models are not able to explain the SN explosion
Neutrino oscillations in SN We consider the system of 3 active neutrinos nf=(ne, nm, nt), mixed in vacuum such that nf=Unmwhere nm=(n1, n2, n3) is the vector of mass eigenstates and U is the mixing matrix. If neutrinos have mass they could oscillate between flavors. The oscillation is resonantly enhanced if a flavor-asymmetric medium is present (MSW matter effect). The medium density r res for the resonance tooccur depends on the oscillation parameters.The wide range of density values in the SN matter allows for 2 resonance levels. The resonance is expected for nor n depending on the mass hierarchy (=sign of Dm2atm)
Neutrino interactions in LS (-) (-) (-) (-)
n CC interactions on 12C nuclei Eth=17.8 MeV e=85% ne12C, 12N e-,observed through two signals: the prompt one due to the e-above eh (detectable energy Ed Ene - 17.8 MeV)followed by the signal, above eh , from the b decay of 12N (mean life time t = 15.9 ms). Elastic scattering 8 Eth=13.9 MeV e=70% ne12C, 12B e+,observed through two signals: the prompt one due to the e+ above eh (detectable energy Ed Ene - 13.9 MeV + 2 me c2),followed by the signal, above eh , from the b- decay of 12B (mean life time t = 29.4 ms). Detector modularity allows precise event tagging
n NC interactions on 12C nuclei g 15.11 MeV energy deposit Elastic scattering e=55% 8 The NC carbon reaction allowsa bolometric flux measurement, “oscillation” independent. An energy window is selected to look for excess of events due to this reaction P. Antonioli et al., NIM A309 (1991) 569
n Fe n p nucl-th/0003060 nucl-th/0003060 Vissani-Strumiaastro-ph/0302055 Neutrino interactions in iron The considered interaction is: ne56Fe, 56Co e-
Results • the nb of interaction in iron is 15% of the total number interactions n-Fe
А t T How can the neutrino burst be identified ? Detection of a burst of N pulses in a short time interval T
Search for SN burst: detector performances Most recently analyzed data set: 4.2.2005 - 13.4.2006 Effective time: 430.5 days Average trigger mass: 940 t Duty cycle: 99.98 %
Search for SN burst: the method • SN selected pulses: • Filter noisy counters • Energy in the 7-100 MeV range Then we perform an analysis of the time sequence. We define a cluster as a set of m subsequent events in the time window of duration Dt . For each cluster (m, Dt) we compute the probability that it is due to poissonian fluctuations of the flat background. We have an alarm if the probability that the event is given by background is below one per century
Search for SN burst: results Galactic SN signal m>3m>6m>10m>16m>30 LVD Data since 1992 Upper Limit to SN event in the Milky Way 0.18/year (90% c.l.)
Neutrino burst detection Expected Fermi-Dirac n-spectrum from core collapse <E>10 MeV for ne ,ne (ni) and <E>15 MeV for (nx) Tne = 3 MeV a pessimistic assumption
Scientific community 1012 109 106 Interval (yr) 103 100 Nb of active experiments The SNEWS system SK LVD SuperNova Early Warning System: working group between experiments looking for SN burst (currently LVD, SK, SNO, Amanda; Borexino,MiniBoone and KamLAND expected to join) Since July ‘05 BROOKHAVEN server AMANDA SNO Every experiment looks for SN burst and send alarm at average rate of 1/month Network as much as possible fault tolerant Give prompt information to astronomical comunity. Doing online twofold coincidence allows to send a prompt alarm and to reduce to zero fake alarm! http://snews.bnl.gov/alert.html
ne+ p e+ +n Inverse beta decay (double signature) n + p d +g 1. Positron detectionfollowed by ... 2.Gamma (2.2 MeV) from neutron capture ( t = 200 ms) Eg = 2.2 MeV t= 200 ms Energy (MeV) Delay (ms) Neutron capture efficiency = 60% (from 252Cf measurement)
Gd in LVD scintillator Two counters (1.5 m3 each) have been Gd-doped up to 0.1% in weight (work done at LNGS together with C.Cattadori, Bezrukov et al.): • 1st tank doped in May 2005, placed in the Mounting Hall @ the external LNGS laboratories; • 2nd tank doped in Oct. 2005, inside the LVD experiment in the LNGS Hall A. Gd carboxylate (Gd-CBX):
Background at low energy In order to detect the 2.2 MeVg from neutron capture, the value of the low-energy threshold is ~0.8 MeV. • The counting rate in the low energy region is related to the position of the counter inside the apparatus => the bkg sources are external to the detector • In the low energy region (E <2 MeV) the main bkg source is natural radioactivity (222Rn). • The average rate over the low-threshold is <flth>~230Hz.
ne+ p e+ +n Gd in scintillator • three main improvements: • increase of the neutron capture cross section(from 0.33 barn to 250000 barn) • increase of the gamma energy(from 2.2 MeV to about 8 MeV) • decrease of the capture mean time (from 180 ms to about 30 ms)
Results with Gd (Neutron source: 252Cf) Neutron Capture Time Energy spectrum t= 24.7 ± 1% t= 202.3 ± 1% Black: before Gd doping Red: with Gd inside
Detector performances with Gd Change the value of the low-energy threshold (0.5÷4.5 MeV) and look at the resulting • neutron detection efficiency (signal) • Background rate For comparison, requiring the same efficiency of the non-doped case (60%) the bkg rate is about 12 Hz, instead of 230 Hz.
Scintillator Stability Neutron capture efficiency • The stability of the scintillator has been monitored for 170 days measuring • neutron capture efficiency • mean time • Consistent with a flat behaviour • Other measurements are done on smaller samples by directly measuring transmittance, light yield, and fluor concentration … result still preliminary • The monitoring is going on ... Average capture time