Download
1 / 20
200 likes | 330 Vues
This research explores the accuracy of multi-parameter response surfaces developed from sensitivity coefficients within the context of air quality planning. The project, funded by the U.S. EPA STAR Program, aims to quantify uncertainty in models that guide state-level air quality attainment plans. Key objectives include evaluating pollutant responses to emission reductions and assessing their health impacts. The study also incorporates uncertainty analysis to enhance the decision-making process in multi-pollutant, multi-objective integrated air quality planning, leveraging advanced modeling techniques for improved predictions.

E N D
Accuracy of multi-parameter response surfaces generated from sensitivity coefficients Daniel Cohan and Antara Digar CMAS Conference 2009 October 19, 2009
U.S. EPA – Science To Achieve Results (STAR) Program Grant # R833665 Incorporating Uncertainty Analysis into Integrated Air Quality Planning DANIEL COHAN (PI) DENNIS COX ANTARA DIGAR JAMES BOYLAN MICHELLE BERGIN BYEONG-UK KIM MICHELLE BELL MENG JI ROBYN WILSON
Project Objectives • Quantify uncertainty in the modeling that informs state-level air quality attainment plans • Control costs and emissions reductions • Pollutant responses to emission reductions • Health impacts • Explore how uncertainty can be communicated and incorporated in the decision-making process
Multi-pollutant, multi-objective air quality planning How can we objectively evaluate disparate control options, impacting different precursors, sectors, and locations? Source Emission Ambient Impact Societal Impact NOx Ozone Human health Attainment VOC PM2.5 SO2 N deposition Visibility NH3 Ecosystems and crops Acid deposition PM
Integrated Evaluation of Control Options • Cost Assessment • Control costs and emissions reductions $, Tons ppb/ton ppb, Impacts • Air Quality Modeling • Pollutant sensitivities to emissions reductions How uncertain??? • Attainment Evaluation • Improvement at monitors • Health Assessment • Health benefits Cohan et al., Environmental Management 2007
Causes of Uncertainty in Modeled Concentrations and Sensitivities • Parametric Uncertainty: Caused by uncertainty in model input parameters • Emission inventory, reaction rates, boundary conditions, etc. • Focus of this study • Structural Uncertainty: Caused by imperfections in the model’s numerical representations of atmospheric chemistry and dynamics • Model/User Error
How parametric uncertainty affects sensitivity to ΔEmissions ΔEi* Digar and Cohan, manuscript in preparation
Impact of Emission Control Under Parametric Uncertainty ΔE R(NO2+OH) RJs R(NO+O3) Dwd Bio VOC BC (O3) Dwd Anth VOC Dwd NOx BC (NOy) Monte Carlo CMAQ impractical – Need more efficient approach ΔC Probability distribution of pollutant response (ΔC) to emission control (ΔE)
Efficient characterization of parametric uncertainty by response surface equations 1. Compute high-order sensitivities relating (Inputs) to (Pollutant Response) -- E.g.: (∂2Ozone/∂ENOx∂EBioVOC) shows how biogenic VOC inventory affects sensitivity of ozone to NOx emissions 2. Create “surrogate model” of pollutant response to ΔEmissions as function of uncertain inputs -- ΔCactual = F(ΔEmissions, ΔInputi,j,k,…) (Taylor series) 3. Apply Monte Carlo sampled inputs in surrogate model to generate probability distribution for ΔC ΔC ΔE
How to compute sensitivities:Brute ForceorDecoupled Direct Method Conc. CE+10% Cbase CMAQ-HDDM (in base case) CE-10% Brute Force (3 runs; finite difference) Emissions -10% +10% Ebase
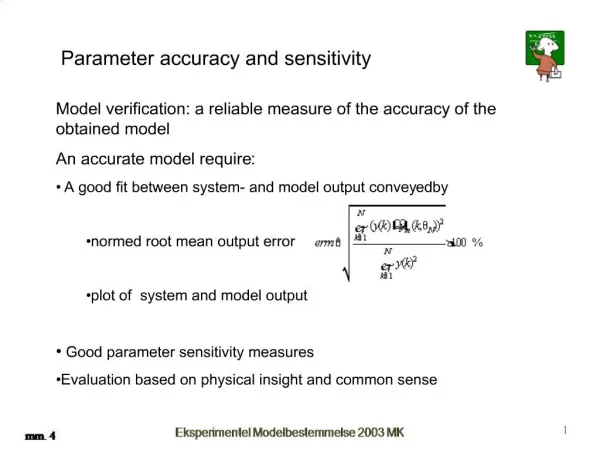
Computing concentration response to emission reduction under uncertainty(2nd-order Taylor expansion) • Impact of ΔE if no uncertainty in inputs: ΔEj = -εjEj ΔC = εjSj(1) - 0.5εj2Sj(2) + … • Impact if Φk error in each input parameter Pk: Pk*= (1+Φk)Pk Pj*= (1+Φj)Pj ΔEj* = -εj(1+Φj)Ej ΔC* = (1+Φj)εjSj(1) - 0.5(1+Φj)2εj2Sj(2) + (1+Φj)εjΣ(ΦkSj,k(2)) Previously shown accurate for ozone response to +/- 50% emissions • ??? How accurate for big changes in multiple inputs ??? • We’ve assumed: (1) Accurate sensitivity coefficients; (2) 2nd-order sensitivities sufficient; (3) Additive impacts of input uncertainties
??? Does it Work ???Accuracy Testing of Surrogate Model • 3-day air pollution episode from Georgia SIP • CMAQ v. 4.5 with CB-IV chemistry, 12-km grid • Year 2002 meteorology with Year 2009 emissions • Evaluate surrogate model up to 50% E and Inputs
Highly accurate predictions of impact under extreme uncertainty
8-hour Ozone Performance Actual impact of -50% Atlanta NOx, if +50% E_NOx, E_VOC and R_photolysis Prediction Neglecting Uncertainty Surrogate Model Prediction
24-hour PM Sulfate Performance Actual impact of -50% Atlanta SO2, if +50% E_SO2, E_NH3, and R_photolysis Prediction Neglecting Uncertainty Surrogate Model Prediction
Special Case: Discrete control options at coal-fired power plants • Largest point sources of NOx and SO2 • Major focus of Georgia control efforts • Discrete control options • SCR ~85% NOx reduction • Scrubber ~95% SO2 reduction • Replace w/natural gas 85% NOx, 99.8% SO2 cut • Amount of emission reduction independent of domain-wide inventory
“Discrete Model” to predict impact of known emission reduction • Compute ΔC impact of power plant control under: • Base case conditions • Pk reduced by 10% • Response coefficient: Fk = 10(ΔCbase-ΔC-10%) • Predict impact when multiple Pk are uncertain: ΔC* = ΔCbase + ΣΦkFk Input Pk Targeted Reduction Base Case Power Plant Emis Pk,-10% 4 runs to determine each Fk
Accuracy of Discrete Model Impact of Plant McDonough natural gas, if input parameters +50% Even more accurate than continuum model, because targeted at predetermined emission reduction
Discrete model performance for +50% change in input parameters Actual PM_SO4 Impact of -99.8% McDonough SO2 Predicted PM_SO4 Impact of -99.8% McDonough SO2
Conclusions • New methods efficiently characterize impact of emission reductions under parametric uncertainty • Can use HDDM or brute force • Continuum model well suited to flexible % controls • Discrete model applicable when % control is known • High confidence that both methods accurately represent relationships in underlying model • Caveat: Methods only as good as underlying model • Next talk: Applying surrogate model to estimate likelihood of attainment for SIP strategy