Download
1 / 23
270 likes | 575 Vues
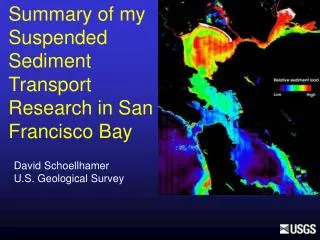
Three-Dimensional Hydrodynamic Modeling of Sediment Transport in San Francisco Bay Using SUNTANS. By Yi-Ju Chou Collaborators: Sueann Lee, Vivien Chua, Oliver Fringer, Jeff Koseff, Stephen Monismith Environmental Fluid Mechanics Laboratory Stanford University.

E N D
Three-Dimensional Hydrodynamic Modeling of Sediment Transport in San Francisco Bay Using SUNTANS By Yi-Ju Chou Collaborators: Sueann Lee, Vivien Chua, Oliver Fringer, Jeff Koseff, Stephen Monismith Environmental Fluid Mechanics Laboratory Stanford University http://stanvonog.com/?tag=oceanbeach
Outline • Motivation • Model Framework • Hydrodynamic Validation • Sediment Module Development • Preliminary Results • Future Work
Motivation • Development of a calibrated 3D SF-Bay sediment predictive and diagnostic tool for -- Ecological restoration -- Climate change -- Contaminant transport -- Management issues
Model Framework • Stanford Costal Ocean Model – SUNTANS • Features -- Unstructured grid -- Wetting and drying -- High-resolution transport scheme
Hydrodynamics Validation Grid resolution: horizontal 200 m in average; 50 m minimum 60 vertical layers (minimum dz = 0.9 m) Date: Jan 1st 2005~Jan 30th 2005 Open boundaries: Pacific Ocean & Sacramento-San Joaquin Delta Data source: bathymetry – National Geophysical Data Center fresh water inflow – DAYFLOW program (CDWR 1986) tidal forcing – 8 major tidal constituent measured at Fort Point (Courtesy by Vivien Chua)
Hydrodynamics Validation Point San Pablo Benicia Dashed: SUNTANS predictions Solid: observations
Sediment Module: Non-cohesive Sand • Sediment bottom BC: mass flux = Pk – Ws Cb • Channel Case Validation • Domain: 40,000 m x 100 m x 10 m (Initial) (L x W x H) • Grid: 400 x 2 x 20 • Time step: 15 s • Total time: 48,000 x 15 • Ws = -0.002 ms-1 • BC: no flux from the left; free flux at the right
Time = 15 s Time = 90 s Time = 210 s Time = 435 s Time = 735 s Time = 1200 s
C/Ca C Ca Temporally Averaged Normalized Concentration Profiles: Black dashed: Rouse curve Colored: model results Ca: concentration near the bottom
Erosion Erosion Erosion Consolidation Consolidation Consolidation Sediment Module: Cohesive Sediment (Mud) Flocculation settling Water column Particle hindering Deposition Resuspension Weak fluid mud Fluid mud Consolidated bed
Parameter Setup (following Lee et al, ECM 2003) Layer thickness (mm) Dry density (kg m-3) τce for erosion (N m-2) α in erosion Consolidation, T, (g m-2s-1) Erosion rate, E0, (g m-2s-1) 0.03 0.02 0.02 0.02 0.02 180 450 600 750 900 0.10 0.41 0.45 0.47 0.52 6.5 6.5 6.5 6.5 6.5 0.001 0.001 0.001 0.001 0.002 25 50 50 50 1000 Settling velocity = f(c) Layer number = 5 (1~5 in SUNTANS) 10,000 mg L-1 ws Erosion (Parchure & Mehta,1985): 10 mg L-1 180,000 mg L-1 C Consolidation: Bottom shear stress: τ = τc + τw (US Corps of Engineers)
Jan 5th 2:00 U (m/s) SSC (mg/L) 2005 Jan01 1200 Jan 5th 4:00 2005 Jan01 1400 Jan 5th 6:00
Jan 5th 8:00 SSC (mg/L) Jan 5th 10:00 Jan 5th 12:00
Jan 5th 14:00 SSC (mg/L) Jan 5th 16:00 Jan 5th 18:00
200 0
Work Summary • SUNTANS-SED-SFBay features -- Unstructured -- Wetting and drying -- High resolution transport scheme -- Validated hydrodynamics for Jan 2005 -- Multi-layer mud bed -- Non-uniform sediment bed structures -- Simple wave model (US Corps Engineers) • Simulation Results -- SSC sensitive to settling velocity -- SSC less than field measurement; wave forcing?
Model Challenge: 1. Sediment Properties • In-situ sediment properties measurement -- Erosion rate -- Critical shear stress -- Flocculation, hindering, settling velocity -- Missing properties of mud layers Sedflume Data Report San Francisco Bay Mudflats Sea Engineering, Inc.
Fluid-mud suspension Hard bed erosion
Balance of wave action density (e.g SWAN) Model Challenge: 2. Non-uniform Wind Field Significant wave height Wave orbital velocity: Ub Radiation stress Deposition Resuspension Stationary suspension (high conc.) Real-time SF Bay wind patterns (from http://www.met.sjsu.edu/cgi-bin/wind/windbin.cgi?x=309&y=289) Erosion Fluid mud Consolidation Under Consolidated Bed
Information Gap Sediment-water interface • Proper boundary conditions for sediment erosion and deposition. • In-situ measure on mud layers. • Parameterization of small-scale bedforms (sand bed).
Acknowledgement • Mark Stacey, UC Berkeley • Dave Schoellhamer, USGS Sacramento • California State Coastal Conservancy