
Scatter Plots of Total Folate by MTHFR C677T Genotype and Assay Method Comparison
This figure presents scatter plots illustrating the correlation of total folate (TFOL) levels with the MTHFR C677T genotype. Panel A compares results obtained from LC-MS/MS and microbiologic assay (MA), while Panel B contrasts BioRad (BR) with MA. Additionally, Panels C and D further analyze the correlations between LC-MS/MS and MA, as well as BR and MA, across various sample sets. These comparisons help to assess the reliability and agreement of different assay methods used for measuring total folate concentrations in relation to genetic variations.

Scatter Plots of Total Folate by MTHFR C677T Genotype and Assay Method Comparison
E N D
Presentation Transcript
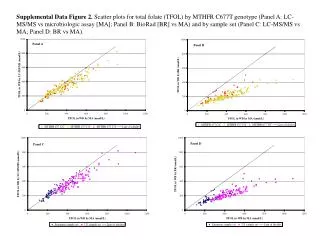
Supplemental Data Figure 2. Scatter plots for total folate (TFOL) by MTHFR C677T genotype (Panel A: LC-MS/MS vs microbiologic assay [MA]; Panel B: BioRad [BR] vs MA) and by sample set (Panel C: LC-MS/MS vs MA; Panel D: BR vs MA).