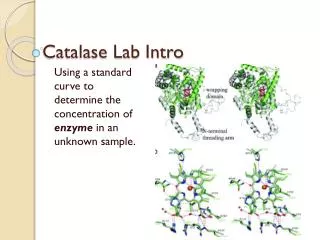
Catalase Lab Intro
Catalase Lab Intro. Using a standard curve to determine the concentration of enzyme in an unknown sample. Using a standard curve. Definition - a type of graph used as a quantitative research technique.

Catalase Lab Intro
E N D
Presentation Transcript
Catalase Lab Intro Using a standard curve to determine the concentration of enzyme in an unknown sample.
Using a standard curve • Definition - a type of graph used as a quantitative research technique. • Multiple samples with known properties are measured and graphed, which then allows the same properties to be determined for unknown samples by interpolation on the graph. • The samples with known properties are the standards, and the graph is the standard curve.
How can standard curves be used ? • See sample lab document for glucose testing • Research other uses for your formal lab introduction!
Examples of Standard Curves • What is the X axis? • What is the Y axis?
How will we use a standard curve today? • Predict unknown concentration when you test for the independent variable. • “Assay”: analytic procedure to quantitatively measure the amount of activity in a sample. • Use the results of the “assay” to predict unknown concentration.
Your job • Figure out the role of catalase in cell and why it is essential in cells. • Design a standard curve to assay for the concentration of catalase in an unknown sample. • Determine what type of best fit line fits your data. • Estimate the concentration. • Suggest a second run based on the information you found to further refine your value. • Connect the methods for this lab to a real-world problem.
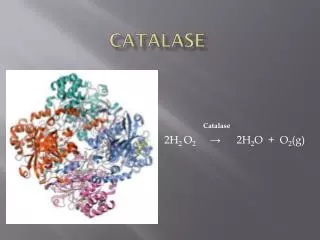
Our Model System • What does catalase do? • H2O2 H2O + O2 • What can you “assay” for?
Lab Scenario • Catalase: • You are working for a drug company and you want to make a “generic” of the enzyme based drug another company produces. • You must determine how much of the active ingredient is present in the drug. • Your research in the papers suggests the concentration is between .1 and 10% (mass (g)/volume (ml)) • The closer to the exact amount you can come, the better your generic will work!
Methods and Materials • Shared Materials: • Bottles of 6% and 3% H2O2 • 2 blenders (must be cleaned with soap at the end!) • 2 electronic balances • Individual Materials: • ~25 g liver—source of catalase • Conical tubes for reactions • 2-disposable pipettes • 2-1mL graduated pipettes • Weigh boats • 50 mL grad cylinder • 250 mL beaker
Lab Design • Determine the independent and dependent variables to set up your standard curve • What will you control for? • FOCUS: What would I need to know to exactly repeat your methods?
Data Analysis • Is your curve linear? logrithmic? How do you know which type of line to choose? • Statistical Tool #3 – Residuals! • Calculate “Y hat” • This is the Y value for each X if the equation is used (rather than having your values be plotted) • Residual = Yobserved-Yhat • Graph residuals vs. X. If there is no pattern, then the regression line captures the overall pattern. http://www.youtube.com/watchv=6HcyewrPNEw