Download
1 / 17
170 likes | 632 Vues
Dam Control of Flow Rates on the Scioto and Olentangy Rivers. The Purposes of the Dams. O’Shaughnessy dam impounds O’Shaughnessy Reservoir for the city water supply. Delaware Dam impounds Delaware Lake for flood control. Both reservoirs also provide multiple recreational activities.

E N D
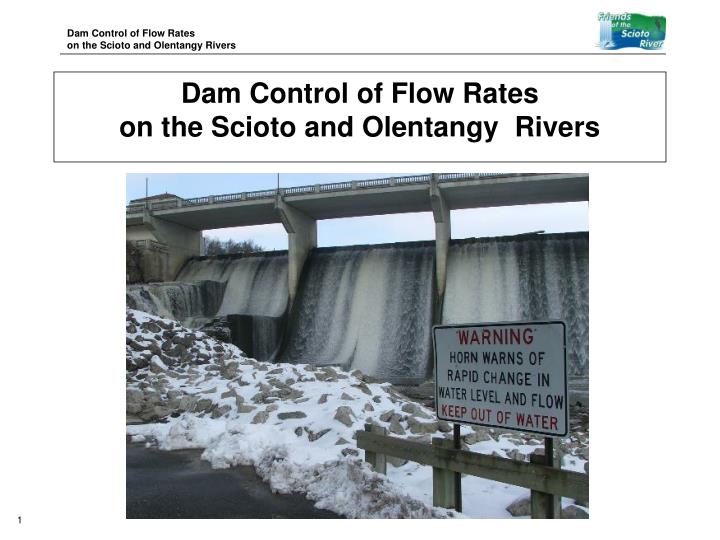
Dam Control of Flow Rates on the Scioto and Olentangy Rivers
The Purposes of the Dams • O’Shaughnessy dam impounds O’Shaughnessy Reservoir for the city water supply. • Delaware Dam impounds Delaware Lake for flood control. • Both reservoirs also provide multiple recreational activities. • The Delaware and O’Shaughnessy dams can alter the flow rates, to control levels downstream.
The Sources The United States Geological Survey (USGS) operates stream gauge stations at several points on the Scioto and Olentangy rivers.Most provide discharge readings in cubic feet per second (CFS). Station 03221000 below O’Shaughnessy Dam
The Data The data from the gauges are available online. You can look back 1 to 120 days. You can select output as a graph or table. Tabular output can be copied from the pages, and pasted into another application.
The Processing The copied data can be pasted into a spreadsheet.The spreadsheet can draw graphs from the data.This lets you create alternatives to the USGS graphs, with your own scale and timeframe.
The Processing You can enter data from more than one station into the spreadsheet.Then, you can create graphs that show multiple stations, in the same timeframe.
The Rain Event Over the 2010 Thanksgiving weekend, 2 - 3 inches of rain fell in the upper Scioto watershed.This image shows the rainfall totals for part of the timeframe shown in these charts. 9:00AM 11/24 - 8:00 AM 11/26
The Scioto at Prospect This station is the farthest upstream, in Delaware Co. This part of the watershed received the most rainfall. The flow rises from 27 CFS to 1,490 CFS. The rate of rise is gradual, over the course of about 24 hours. It reaches its peak near hour 60.
The Scioto at O’Shaughnessy This station is immediately below the dam. It shows the rate of flow past the dam. The reservoir behind the dam was very low before this rain event. The dam is releasing less than 20 CFS until hour 50, then rises to 200 CFS by hour 65, then 978 CFS by hour 72.
The Scioto at O’Shaughnessy When there is such a large variation in readings, it can help to apply a logarithmic scale to the graph.This better shows the lower values. The dam is releasing less than 20 CFS until hour 50, then rises to 200 CFS by hour 65, then 978 CFS by hour 72.
The Scioto at Jackson Pike This is the river level below downtown, showing the effect of fast stormwater runoff from the city center. This part of the watershed received the least amount of rain in this event. Flow begins around 400 CFS, rising to 800 CFS, then to almost 3,000 CFS by hour 30. Then it declines until around hour 50, then rises again after hour 60.
Scioto Flow Overlay The river slowly rises at Prospect, filling the lake while the dam stays closed. The river spikes quickly and sharply downtown. As the level stabilizes downtown, the dam begins to open. The dam is adding almost nothing to the flow for most of the timeframe.
The Olentangy at Delaware Again, the gauge is immediately below the dam. The flow is held below 120 CFS, but rises to exactly 1,500 CFS between hour 32 and hour 48. At hour 65 it rises to almost 2,000 CFS.
The Olentangy at Worthington Here, the flow is uncontrolled. All of the impervious surfaces between the dam and I-270 add to it. Again, the numbers start around 120 CFS, but they change erratically. The shape of the curve illustrates “fast rise, exponential decay” as the river surges and drains.
Olentangy Overlay We see the dam holding back while the river fluctuates. Once the river begins to drop, the dam begins to open. The river is at 500 CFS, the dam opens to 1,500 CFS, and after a lag the total is 2,000 CFS. While the dam flow shows steady lines, the river flow still shows gradual decay.
Scioto/Olentangy Overlay Now we see the dam opening in relation to the flow below town. The flow drops on both rivers until the dam opens, then there’s a lag before the increase shows at Worth-ington, and then at Jackson Pike. The second, smaller increase just begins to show at Worthington at the end of the timeframe.