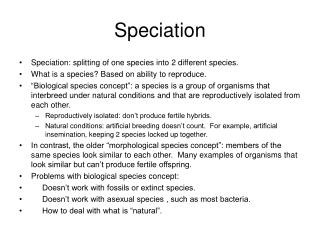
Mercury Speciation and Distribution at 40°S in the Southern Atlantic Ocean
190 likes | 322 Vues
This study presents the first detailed examination of mercury (Hg) speciation in the water column at 40°S in the Southern Atlantic Ocean, as part of the JC068 sampling expedition. Our goals include determining Hg species using high vertical resolution measurements to enhance understanding of the oceanic Hg cycle. Results indicate varying concentrations of total mercury (THg), methylmercury (MeHg), and dissolved gaseous mercury (DGM) across depth, influenced by anthropogenic activities and biogenic factors. Insights gained from this research contribute to the Global Mercury Observation System and Geotraces projects.

Mercury Speciation and Distribution at 40°S in the Southern Atlantic Ocean
E N D
Presentation Transcript
Hg speciation along 40°S Arne Bratkic, Mitja Vahcic, Milena Horvat Jožef Stefan Institute Ljubljana Slovenia
Overview • Introduction: • goals and hypothesis • What we measured • sample list • How we measured • determination of Hg species • Results • Some conclusions
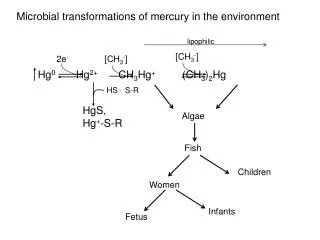
Hg cycle in water and sources to water bodies Sources of Hg to open ocean include river discharges, wet and dry atmospheric deposition, sediments and hydrothermal vents in geologically active areas. Except last, the rest can be heavily impacted by human activities.
Goals • JC068 is first sampling (for Hg) in such detail in South Atlantic • to determine Hg speciation in water column with high vertical resolution for use in Geotreaces and Global Mercury Observation System projects • collect additional samples to further elucidate open ocean Hg cycle
Hypothesis • are double MeHg peaks, as a result of primary production and mineralization of organic matter, observable? • to detect Hg contamination of antarctic waters, due to Hg depletion events over Antarctica, ice melting and river transport
Determination of Hg species Sampling Hg0, DMeHg Hg2+, MeHg Sample preparation (filtration, stabilization, storage) Isolation (distillation, extraction, oxydation/reduction) Isolation (bubbling / preconcentration) Derivatization (ethylation) DMeHg MeHg: LOD 0,75pg/L (3.5fM) Hg species separation (GC, HPLC) Hg0 Detection (AFS HP, AAS HP, ICP MS)
Results - THg • onboard measurements give better reproducibility and are more reliable • contamination issues with inappropriately clean reagents, work area or during transport • (vacuum packing is a good option) portable Hg lab oratory on canadian icebreaker Amundsen 10% error bars
Results - THg average: 0.32 ng/L stdev: 0.2 ng/L red circles denote possible increase due to atmospheric deposition and DGM oxidation there is no apparent trend throughout the water column and no correlations with measured nutrients yellow circle may show increase due to Mid-Atlantic Ridge vulcanism
Comparison with other studies • ratio MeHg : THg = <1 – 18% • 2-48pg/L MeHg (9-223fM) • 0.08-2.54 ng/L THg (0.37-11pM) Mason et al., 2012
Results-MeHg red circle: MeHg conc. are higher from 1200m downward. This is possibly anthropogenic signal or a consequence of intensive haterotrophic degradation upwelling zone, source of MeHg? red circles: peak in MeHg is suggesting association with particulate matter in bioactive layer yellow circles: anthropogenic signal? MeHg is expected to be higher in two layers of intensive bioactivity Heimburger et al., 2012
Results - MeHg seasonality 500m J A S O N D J F M A M J J A S O N D J F M A M J 200720082009 Heimbürger et al., 2010 Open-ocean water column MeHg production coupled to Corgremineralization (Cossa et al., 2009; Sunderland et al., 2009) MeHg is tightly coupled to food web basis structure (Heimbürger et al., 2010) J A S O N D J F M A M J J A S O N D J F M A M J 200720082009
Results - DGM generally higher DGM values in UCDWand AABW than in NADW red circle: influence of MAR or tectonic processes in Argentinian basin? surface waters are depleted of DGM, signifying its loss to the atmosphere higher values below photic zone may be consequence of heterotrophic presence activity
Results - DGM values below 1000m values for DGM range from 60 to 100 pg/L in ocean water column and represent from 0.9% to 56% of THg values above 1000m DGM is highly correlated with nitrate, and also phosphate and silicate (r values 0.88, 0.89 and 0.92, respectively) Below 1000m is uniformly distributed through water masses and slightly increasing towards bottom.
Results - DMeHg • ranges from 0.09 to 8.28pg/L • DMeHg values are higher below 1000m and highest in UCDW and above bottom • represents up to 1,8% of THg Mason et al., 2012
Conclusions • these are first vertical high resolution quality data for this oceanic region of Atlantic • we did not observe significant patterns in THg • MeHg is produced within ocean water columnand is likely associated with particulate matter of biogenic origin
Conclusions • surface waters are depleted in DGM but enriched in deep waters • significant positive correlation between DGM and nutrients (r≤83) are very interesting
Future work • THg and MeHg in sediments • determination of microbial community and functional genes • comparison of data on nitrogen isotopes, He…
Thank you • special thanks to Gideon for inviting us to the cruise! • with many thanks to Vesna,Kristina and Jozefor help with the measurements!