Motivations
Examining Power Grids Response to PHEVs Charging Demand. Student(s) : Zahra Darabi , Electrical and Computer Eng. Faculty Advisor : Dr. Mehdi Ferdowsi, Electrical and Computer Eng. Motivations. Case Study. Statistical Study- Driving pattern.

Motivations
E N D
Presentation Transcript
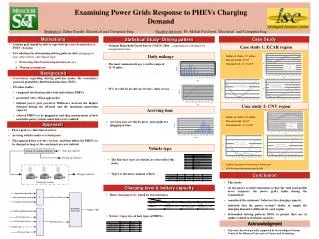
Examining Power Grids Response to PHEVs Charging Demand Student(s): Zahra Darabi, Electrical and Computer Eng. Faculty Advisor: Dr. Mehdi Ferdowsi, Electrical and Computer Eng. Motivations Case Study Statistical Study- Driving pattern • A future grid should be able to cope with the extra demand due to PHEV charging. • Two solutions for determining driving patterns data (plugging-in time, miles driven, and vehicle type): • Extracting Data from transportation surveys • Making assumptions • Case study 1: ECAR region • National Household Travel Survey (NHTS) 2001: comprehensive reference for transportation data • Number of vehicle: 27.7 million • Max. generation: 90 GW • Charging levels: 1.4, 7.68 kW • Number of vehicle: 25.8 million • Max. generation: 40 GW • Charging levels: 1.4, 7.68 kW • A higher charging level causes larger deformation • CNV has larger deformation than ECAR • Daily mileage • The most common mileage is in the range of 25-30 miles. • 55% of vehicles are driven 30 miles daily or less. Background • Uncertainty regarding driving patterns makes the researchers generate probability distribution functions (PDFs) • Previous studies • compared total load profiles with and without PHEVs • presented valley filling approaches • defined power grid potential: Difference between the highest demand during the off-peak and the maximum generation capacity • allowed PHEVs to be plugged in and then measurement of how much the power system constraints were violated • Case study 2: CNV region • Arriving time • Arriving time of vehicles gives some guide for plugging-in time. Approach • Power grid is a collection of outlets. • Arriving vehicles make a virtual queue • This approach first sets the red lines, and then allows the PHEVs to be charged as long as the constraints are not violated. • Vehicle type • The first four types of vehicles are selected for this study. • Type 1 is the most common vehicle. Conclusion • This study: • set the power system’s limitation so that the total load profile never surpasses the power grid’s limits during the examination. • considered the customers’ behaviors for charging requests. • indicated that the power system’s ability to supply the charging demand is different for each region. • determined driving patterns PDFs to permit their use in studies related to stochastic analyses. Charging level & battery capacity • Three charging levels based on two references • Battery Capacities of four types of PHEVs. Acknowledgment • This work has been partially supported by the Intelligent Systems Center at the Missouri University of Science and Technology