Download
1 / 25
250 likes | 262 Vues
This presentation from 2008 focuses on the growth of the service sector in Sweden and the development of short-term indicators. The project plan aims to create a production index for the service sector, with various components and calculations explained in detail. Key elements include turnover, deflators, weights, trading day effects, and seasonal adjustment. The presentation outlines the methodology, challenges, and first results of the Service Production Index (SPI) for various activity groups. Learn about the challenges of estimating trading day effects and the importance of deflators like the Producer Price Index in the service sector.

E N D
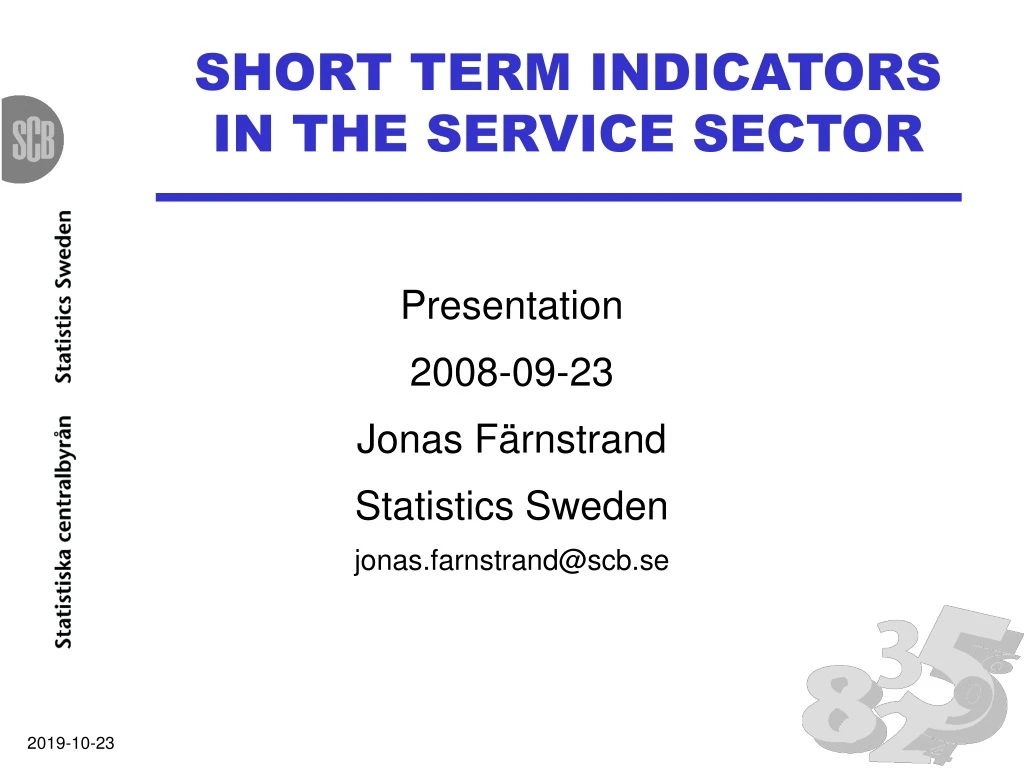
SHORT TERM INDICATORS IN THE SERVICE SECTOR Presentation 2008-09-23 Jonas Färnstrand Statistics Sweden jonas.farnstrand@scb.se
16 14 12 10 8 GDP 01-45 6 50-95 4 2 0 -2 1993K1 1994K1 1995K1 1996K1 1997K1 1998K1 1999K1 2000K1 2001K1 2002K1 2003K1 2004K1 2005K1 2006K1 2007K1 -4 Service sector and GDP
Swedish investigation about the economic statistics 2002 The users of statistics want statistics for the growing private service sector The users want short term indicators, similiar indicators to those in the industry. Production (volume) index, new orders, prices, turnover and capacity The department of Business and Labour Market was given about 600 thousand Euro / year to produce new indicators. Most of this amonth are used to produce a index of service production (ISP) and turnover statistics on a monthly basis.
Project plan with purpose to develop a production (volume) index for the service sector on a monthly basis Starting points and Conditions -OECD manual / Eurostat manual -Great Britain’s production volume index -National Accounts -Discussions with producers and users of economic statistics Goals -Set a design to produce a production index -Publish the first result spring 2008. -Timeliness 35 days after the end of the reference month
Production index in the service sector The theoritical form of the production index is a volume index of Laspeyres type Where q is produced quantity p is price of produced quantity δ is quantity for intermediate consumption a is price of quantity for intermediate consumption i is one of the produced quantities j is one of the quantities for intermediate consumption 0 is the base period t is the present period
Production index in the service sector Qt is just a theoretical index and can not be calculated in practice. Instead consider it as a value added index. According to the theory of value added index the index should be calculated as deflated production value minus deflated intermediate consumption value. To calculate (deflated) value added on monthly basis is very difficult. Instead use some other output as a proxy for value added. We use deflated turnover for each activity as a proxy. To produce production index we also need to weight the activities together up to aggregates.
How to calculate the production index in practice • Weight (wb)is • When applicate base years weights, the production index by time t can then be given by
The main components to construct a short term index • Output (Turnover) • Deflators • Weights ----------------------------------------------------- • Trading Day effects • Seasonal adjustment
Turnover • Sampled based survey on a monthly basis • Coverage NACES 50-64, 70-90, 92-93 • Low cut off threshold (> 20 000 Euro / year) • The sampling frame is stratified by activity and size (127 *6) • Total sample size is 7 000 enterprises on monthly basis and 6 000 on quarterly basis
Deflators Best deflator: Producers price index in the service sector (SPPI) • Only produced on quarterly basis • Forecasting of SPPI is done for the present month by a forecasting model, exponential smoothing Other deflators: Consumer price index (CPI), wage index (WI), producers price index in industry (PPI), import price index (IMPI) – all indices are produced on monthly basis
List of deflators – per NACES Service production index for quarter 20071 compared to 20061, constant prices in 20061 Nace Def Prel Diff (%) Priceindex Periodicity 50 104,2 104,2 0,0 CPI Month 51 104,3 104,3 0,0 PPI Month 52 106,3 106,3 0,0 CPI Month 55 105,9 106,7 -0,8 SPPI, CPI Qrt, Month 60 103,5 103,5 0,1 SPPI, CPI Qrt, Month 61 93,8 92,3 1,6 SPPI Qrt 62 101,4 103,8 -2,4 SPPI Qrt 63 106,8 106,6 0,2 SPPI, CPI Qrt, Month 64 108,0 108,0 0,1 SPPI Qrt 70 99,1 99,1 0,0 SPPI, CPI Qrt, Month 71 111,0 111,0 0,0 SPPI, PPI Qrt, Month 72 108,5 109,1 -0,6 SPPI Qrt 73 86,0 86,0 0,0 SPPI, IMPI Month 74 111,0 111,5 -0,5 SPPI Qrt, Month 80 104,1 104,1 0,0 CPI, WI Month 85 110,1 110,1 0,0 CPI, WI Month 90 110,0 110,0 0,0 SPPI Qrt 91 115,0 115,0 0,0 WI Month 92 100,3 100,3 0,0 CPI, WI Month 93 101,5 101,5 0,0 CPI Month Total 105,4 105,6 -0,2
Weights • Value added weights (from SBS survey) • Yearly weights • The weights are updated every year (small changes though)
Trading day effects and seasonal adjustment • Estimation of trading day effects - Regression model, based on time series data (Major part of activities) - Expert group estimating trading day effects (Retail Trade) - It’s very difficult to adjust for trading day effects in an accurate way!! • Seasonal adjustment of the index serie - No seasonal adjustment, because of too short serie (2005- )
First results, total SPI Index present month compared to same month previous year (index=100)
120 115 In current 110 prices Index 105 In volumes, 100 trading day adjusted 95 50-52 60-64 70-74 80-85 90-93 50-93 TOTAL Activity group by NACE First results, SPI by activity group Index, first quarter 2008 compared to first quarter 2007 (index=100)
Wholesale price index • First publishing - Press release - Press conference • Monthly publishing - Timeliness, 50 (35) days after reference month - Press release (web page) - Statistical databases
Wholesale price index • PPI data for 76 products (CPA) • PPI with 1990 = 100 • These products are weighted together to 15 product groups (Statistics Sweden product groups) • Weigthing in this step is done by weights from PPI (which is based on yearly Prodcom data)
Wholesale price product groups • Agricultural and chemicals • Paper, skins and leather materials • Iron, steal, metal and scrap • Building and hardware materials • Machine and equipment related goods • Food • Alcoholic beverages • Other everyday commodities • Clothes, shoes and suitcases • Home equipment and electronics • Sportswear, toys, motorbikes • Pharmaceptical products • Cars and trucks • Parts and accessories of motor vehicles • Gas and motor fuel
Deflators for activities • ISP results for 15 activities within NACE 51 (511, 512, 513, 5141-5142, 5143-5144, 5145-5147, 5151, 5152, 5153, 5154, 5155, 5156, 5157, 518 and 519) • Turnover by products calculated within SBS (earlier presentation) • Wholesale product group price indices weighted together by the turnover shares from SBS within each activity • Deflators with 1990 = 100 • Calculated with average of last year as base
Thank you! Questions?