Download
1 / 46
460 likes | 605 Vues
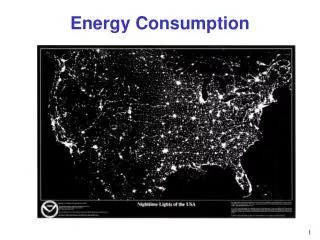
Sharing and Communication around Household Energy Consumption. Tawanna Dillahunt Advisor: Jennifer Mankoff HCI Institute Carnegie Mellon University. U.S. households consume over 21.7% of total U.S. energy and generate over 21.1% of total U.S. carbon emissions [Gardner, et. al , 2008].

E N D
Sharing and Communication around Household Energy Consumption Tawanna Dillahunt Advisor: Jennifer Mankoff HCI Institute Carnegie Mellon University
U.S. households consume over 21.7% of total U.S. energy and generate over 21.1% of total U.S. carbon emissions [Gardner, et. al, 2008] Removed picture due to file size
Low-Income Households • 30% of U.S. households make < $30K/year [US Census, 2009] • Spend greater percentages of income on energy than affluent households [Cooper et al., 1983] • Median consumption almost as much as affluent households [Shui 2002] Removed picture due to file size
Research Gap • Low-income individuals are among those more likely to live in rental housing [Belsky and Drew, 2007; McArdle, 2009] • Renters constitute 30% of U.S. households [Current Housing Reports, 2008] • Few studies (at the time) targeted low-income households and renters [Chetty, et. al, 2008]
Research Questions • What are the dynamics of low-income households in terms of energy consumption? • How can household electricity monitoring devices most effectively work within the dynamics of a low-income household? • Can we mine energy monitoring data in order to provide advice about inefficiencies in energy use?
Thesis Statement Eco-visualizations designed to allow individuals to compare their consumption with others, to provide advice about inefficiencies and to actively engage around actions that affect energy consumption will: • encourage social interaction • raise awareness of energy conservative behaviors • help residents to negotiate energy use issues with stakeholders (landlords, housemates, community members)
What are the dynamics of low-income households in terms of energy consumption?
Qualitative Studies of Energy Use Study 1 Energy Use in Low-Income Households [Dillahunt, et. al, Ubicomp 2009] Study 2 Conflicts Between Landlords and Tenants [Dillahunt, et. al, Ubicomp 2010]
Study 1 • Do prior findings generalize to this community? • Motivations for saving energy? • Existing barriers? • How can we enhance technology to serve low-income communities?
StudyDesign • Photo-elicitation study • [Clark-IbáÑez, 2004] • Camera • Pen and Notebook to write about experiences Removed picture due to file size “Take pictures of objects and/or scenarios that make you think about personal energy use or anything that makes you think about energy”
StudyDesign • 26 participants across two locations • 15 NC participants • 11 PA participants • Diverse payment structures • Pay energy in full • Receive stipend • Pay no energy • Receive allocation Removed picture due to file size
Findings • Participants received very little feedback • Saving energy occurred even if participants did not pay for energy (prior habits) • Key factors leading to environmental behaviors in low-income households • External barriers • Future generations • Religious beliefs • Conflict between landlords and tenants around energy consumption Removed picture due to file size
Findings • Participants received very little feedback • Saving energy occurred evenwhenparticipants did not pay for energy (prior habits) • Key factors leading to environmental behaviors in low-income households • External barriers • Future generations • Religious beliefs • Conflict between landlords and tenants around energy consumption Removed picture due to file size
Findings • Participants received very little feedback • Saving energy occurred even if participants did not pay for energy (prior habits) • Key factors leading to environmental behaviors in low-income households • External barriers • Future generations • Religious beliefs • Conflict exists between landlords and tenants around energy consumption Removed picture due to file size
Study 2 • Interviewed landlords to get a balanced perspective • Story-telling and role play sessions to understand both perspectives Removed picture due to file size Removed picture due to file size
Solution • Sensing technologiesand social computing • can play a role in conflict resolution because of their • abilities to provide new information and improve • communication of information
Opportunities • Sensing technologies produce new information • Social technologies facilitate sharing • Both technologies influence action Removed picture due to file size
How can household electricity monitoring devices most effectively work within the dynamics of a low-income household?
Key Factors to Resolve Conflict • Sharing energy-related information led to community action • Better communication (i.e., alerting landlords to household inefficiencies, informing tenants of ways to save energy) • Negotiation
Thesis Statement Eco-visualizations designed to allow individuals to compare their consumption with others and to actively engage around actions that affect energy consumption will: • encourage social interaction • raise awareness of energy conservative behaviors • help residents to negotiate energy use issues with stakeholders (landlords, housemates, community members)
Research Goals To develop a tool for supporting comparisons and social collaboration Identify how sharing and collaboration affect energy consumption and communication within communities Longitudinal deployment across low-income households of real-time energy monitoring devices to aid in data collection
Method • Flesh out usability details • Website? • Mobile? • Kiosk? • Tool development • Deployment of tool and The Energy Detective (TED) Removed picture due to file size
Main Office (Mezzanine) Build B Build A Longitudinal Deployment Removed picture due to file size
Social vs. Non-Social (Option 1) • Between subject design with two groups • Social • Non-social • Independent Variables • Website comparison and social/discussion features • Dependent Variables • Social interaction • Raised awareness • Negotiation (# of issues reported, interaction with landlord, etc.)
Individual vs. Community (Option 2) • Between subject design with two groups • Individual • Community • Independent Variables • PC versus Kiosk • Dependent Variables • Social interaction • Raised awareness • Negotiation (# of issues reported, interaction with landlord, etc.)
Personal vs. Group Incentive (Option 3) • Between subject design with two groups • Individual • Group • Independent Variables • Group incentive versus individual incentive • Dependent Variables • Social interaction • Raised awareness • Negotiation (# of issues reported, interaction with landlord, etc.)
Quantitative Measures • Encourage social interaction • # of comments, questions asked, questions answered • # of posts to landlords • How frequently do participants access the intervention (kiosk/mobile/website) and how long they interact? • Raise awareness of energy conservative behaviors • Total energy consumption each month • Number of actions “done” or committed to • Negotiation Measures • Issues reported/issues addressed over time
Qualitative Measures (Pre/Post) • Encourage social interaction • Reported interaction with household members, neighbors, landlords • Discussion about intervention and data • Frequency and span of discussions • Raise awareness of energy conservative behaviors • Environmental attitudes • Environmental awareness • Attend outside education events (1st timers) • Negotiation Measures • Issues reported and addressed over time • Was information from intervention used in landlord discussions? • # of successful negotiations
Technology Considerations • Mobile vs. laptop or netbook vs. Kiosk • Mobile makes visualizations harder (push not pull) • PC is less common in low-income households, requires individuals to access the pc for information • Kiosk is less accessible but may help to increase social interaction • Fully networked machine vs. limited functionality • How does adding an internet pc change households?
Can we mine energy monitoring data in order to provide advice about inefficiencies in energy use?
Energy Data Analysis 1: Collect Baseline Data 2: Gather Data • Similar buildings, differing infrastructure • Department of Energy data on averages 3: Data Analysis • Machine learning: automate interpretation 4: Data Interpretation • Help people interpret with a coherent visualization
Pilot Work • Craigslist plug-in • Automate the interpretation of how efficient/inefficient apartments for rent are (like a walk-ability score but for energy) • Location • Apartment Size • Year built • Type of heating and cooling • Types and ages of appliances • Etc. • Compare plug-in estimates with baseline data to show accuracy
Main Contributions • A tool for supporting comparison and collaboration • A model to provide advice about inefficiencies • Design recommendations • Demonstrated results of integrating social computing and ubiquitous computing technologies around energy consumption
Schedule Jun Apr May June July Aug Sep Oct Nov Dec Jan Feb Mar Proposal Prep Doc & Pres Done! Tool Development TED Deployment Gather baseline data Data Analysis (surveys, interaction info….) Dissertation Writing Defense!
Thank You Tawanna Dillahunt tdillahu@cs.cmu.edu Sponsors
Questions & Feedback • What options are more interesting? • Feasibility of providing advice about inefficiencies in energy (based on energy monitoring data) • How to minimize risk? • What if no one interacts with the interventions? • Mobile • Website • Kiosk