Download
1 / 43
440 likes | 651 Vues
The effects of inadequate preparation quality for colonoscopy. Eric Sherer and Michael Catlin August 20 th , 2010 HSR&D Work-in-Progress. Outline. Background Lengthy Adenoma detection rates Appendix… or stand alone???. Outcomes Methods Random questions Compliance Costs Mortality

E N D
The effects of inadequate preparation quality for colonoscopy Eric Sherer and Michael Catlin August 20th, 2010 HSR&D Work-in-Progress
Outline • Background • Lengthy • Adenoma detection rates • Appendix… or stand alone??? • Outcomes • Methods • Random questions • Compliance • Costs • Mortality • Preliminary results ORANGE TEXT => INPUT FROM AUDIENCE
Detection rates - Literature • Harewood et al. 2003 • 93,004 colonoscopies • Adequate vs. Inadequate • POLYPS • <10 MM • Froechlich et al. 2005 • 5,832 colonoscopies • Low vs. Intermediate quality • Low vs. High quality • POLYPS • <10 MM
Unanswered questions • What about adenomas? • Diminutive (<=5mm) vs. small (<10mm) adenomas? • “cannot exclude adenomas <=5mm” • Adjust for individual colonoscopist • Want sensitivity NOT detection rates
Adenoma detection rates Padequate vs. fair = 0.17 Padequate vs. poor < 0.01
Adenoma detection rates Padequate vs. fair = 0.28 Padequate vs. poor < 0.01 Padequate vs. fair = 0.62 Padequate vs. poor = 0.80
Adenoma detection rates Padequate vs. fair = 0.25 Padequate vs. poor < 0.01
Adenoma detection rates • Medium adenomas (6-9mm) • Adequate vs. poor prep qualities • 22% relative difference; 3.2% absolute difference • Adequate vs. fair prep qualities • 13% relative difference; 1.9% absolute difference Padequate vs. fair = 0.16 Padequate vs. poor = 0.21
Adenoma detection rates • Medium adenomas (6-9mm) • Adequate vs. poor prep qualities • 22% relative difference; 3.2% absolute difference • Adequate vs. fair prep qualities • 13% relative difference; 1.9% absolute difference
Outcomes • Effects of inadequate preparation quality • Missed adenomas => Δcancer
Recommendations after 1st colonoscopy • 2003-2010 colonoscopy prep qualities • 1,675 (64.1%) adequate • 750 (28.7%) fair • 187 (7.1%) poor
Effect of inadequate preparation • Rex et al. 2002 • 400 patients • 200 public hospital • 200 private hospital • Authors assumed… • Perfect inadequacy • Perfect compliance • Procedure invariance
Outcomes • Effects of inadequate preparation quality • Missed adenomas => Δcancer • Earlier recalls => Δnumber of tests
Outcomes • Primary • Patient • Δ E[Quality adjusted life-year (QALY)] • Δ E[colon costs] • Δ lifetime CRC risk • Clinic • Δ E[colonoscopies / patient / life-year] • (How many more colonoscopies are done per patient each year) • Secondary • Prep quality intervention
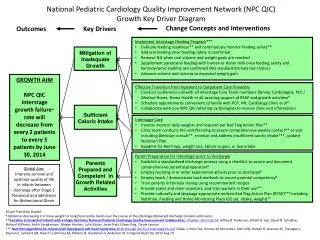
Calculations Monte Carlo trials Implementation All adequate prep scenario “Normal” prep scenario Range of compliances Independent & greedy assumptions To-do: Sensitivity analysis Costs • Select patient • Colon disease free & 50<=age<=80 • r1 Select random prep quality • f (gender, BMI, prev prep quality) • r2 Random colonoscopy findings • History dependent • r3 Select compliance • 40% - 80% reported in literature • Independent events vs. All-or-nothing • r4 Determine follow-up interval • Expected vs. distributed behavior • r5 Age > 80? Age > 100?
Measuring patient outcomes Quality-Adjusted Life Years (QALYs) 40 years Perfect health (utility 1.0) 40 QALYs
Measuring patient outcomes Quality-Adjusted Life Years (QALYs) 40 years Perfect health (utility 1.0) 40 QALYs 80 years Poor health (utility 0.5) 40 QALYs
Measuring patient outcomes Quality-Adjusted Life Years (QALYs) 40 years Perfect health (utility 1.0) 40 QALYs Utility of model states (Ness et al. 2000) 80 years Poor health (utility 0.5) 40 QALYs
Measuringclinic costs • CRC treatment • Initial costs • Continuing costs (Ness et al. 2000) • Colonoscopies • Colonoscopy • Polypectomy • Pathology • Complications • Perforation
Measuringclinic costs • CRC treatment • Initial costs • Continuing costs (Ness et al. 2000) • Terminal care costs not included • Colonoscopies • Colonoscopy • Polypectomy • Pathology • Complications • Perforation
Measuringclinic costs • CRC treatment • Initial costs • Continuing costs • Colonoscopies • Colonoscopy ($614 per procedure) • Polypectomy ($131 for removal of polyps) • Pathology ($67 per polyp examined) (Tafazzoli et al. 2009) • Complications • Perforation
Measuringclinic costs • CRC treatment • Initial costs • Continuing costs • Colonoscopies • Colonoscopy • Polypectomy • Pathology • Complications • Perforation (0.2% incidence, 0.01% mortality) (Tafazzoli et al. 2009)
Measuring mortality Discount each event by the probability of prior mortality.
Measuring mortality Discount each event by the probability of prior mortality. Probability of surviving from age 50 Patient viability with age Ai = age at first colonoscopy Af = current age Patient age
Clinic outcomes E[colonoscopies / patient / life-year]
E[N] of surveillance colonoscopies:Independent event assumption w/ ghosts 26.8% of surveillance colonoscopies due to inadequate prep
Patient outcomes E[QALY / patient] E[colon costs / patient]E[CRC / patient]
Secondary Outcome Effect of prep quality intervention
Big Picture • Overall project Objective: • “Best” time for a patient to receive colon tests • Tools needed • Longitudinal predictions • Test parameters • Cost-utility • Decision analysis
Limitations Discussed in Rex et al. 2002 Additional Likelihood of CRC Intermediate preps, detection & recs Longitudinal adenoma prevalence Study interval bias • Correlation in prep qualities • Additional surveillance colonoscopies