Project Lambda
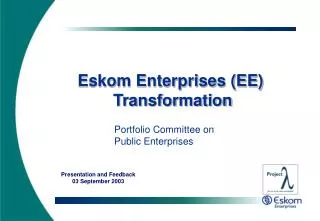
Eskom Enterprises (EE) Transformation. Project Lambda. Portfolio Committee on Public Enterprises. Presentation and Feedback 03 September 2003. Today’s Objectives. To present a brief context of Eskom Enterprises’ transformation

Project Lambda
E N D
Presentation Transcript
Eskom Enterprises (EE) Transformation Project Lambda Portfolio Committee on Public Enterprises Presentation and Feedback 03 September 2003
Today’s Objectives • To present a brief context of Eskom Enterprises’ transformation • To present the positive implications of Eskom Enterprises’s new, chosen strategic direction • To review the critical success factors of the new business case for Eskom Enterprises • To provide feedback which should respond on the queries of the Portfolio Committee on the status of Eskom Enterprsises • To highlight key challenges facing Eskom Enterprises 2
EE Background • Established in 1999 to carry out the non-regulated activities of Eskom inside and outside of Africa. • Inherited numerous “businesses” and capabilities from Eskom, including aircraft, land surveying technologies, IT, telecommunications, primus stove manufacturing, engineering and construction, fleets of vehicles, etc. In total, 48 businesses and divisions! • Core line of business include: • Infrastructure development • Energy business operations • Specialised energy services • Pursuit of key opportunities in related or strategy business (IT, Telecoms) • Outside of South Africa . . . 4
Tunisia Morocco Western Sahara Algeria Libya Egypt Mauritania Senegal Mali Eritrea Niger The Gambia Sudan Chad Djibouti Burkina Faso Guinea- Bissau Guinea Nigeria Côte D’Ivoire Ghana Ethiopia Sierra Leone Central African Republic Cameroon Somalia Liberia Togo Benin Uganda Equatorial Guinea Rwanda Kenya Gabon Seychelles Democratic Republic of the Congo Burundi Republic of the Congo Zanzibar Tanzania Malawi Angola Zambia Mozambique Zimbabwe Completed Projects Ongoing Projects Prospects & Ongoing Projects Prospects Namibia Madagascar Botswana Mauritius Swaziland Republic of South Africa Lesotho 5
EE in the World • Transmission network design and engineering in • Vietnam • India • China. • Possible O&M of Generation Utilities in Sri Lanka • Invitations to participate in: • Mexico • Brazil • United Kingdom • In sum, a full plate. Management and resources were stretched! 6
E E structure diagram Board of Directors Committees of the Board: — Management — Audit — Remuneration — Investment & Procurement — Finance Eskom supplied services: — Internal Audit — Treasury — Confidential Investigations — Safety H / O H / R Manager Finance Manager Co. Secr/ Legal Gvt Liaison # # * * * * * * * * Esk Ent Africa TSI Consulting Rotek Industries Primary Energy Investment Roshcon PBMR Commercial Telecomms IT Services Coal EE Africa: Regions Sapphire Exec Air Rotek Engineering Venture Development Roshcon Division Electricity Africa EE~KOM Arivia.kom Golang Coal ESI~TEL RVS Division ALS Trans Afr Projects e-Commerce TEL~ENG Amazing Amanzi Roshprop Division EE Marketing SDCT Equity Management EON Solutions Bonesa EE Global West Africa Ltd (Nigeria) FBC RVS Dormant Natural Gas Mountain Comm’s TSI Operating PTM Roshprop Dormant GESCO ELGAS Tele-Com Lesotho HEM~KOM Eskom Energie Manantali Waste Energy SKI Lunsemfwa (Zambia) #: Co-ordination, Marketing, Deal Making, Funding : Execution * Media 22/1/2002 7
EE Financial Performance R’ millions Revenue: 2001 – R2 370 m 2002 – R 2 906 m The Chinese describe “crisis” as a time of great danger and a time of great opportunity. We truly have the opportunity to take EE into the future. 8
2002 Results Manantali EON Enerweb Roshcon Rotek EskomHead Office PTN Mountain Comms Sapphire Exec Air & Helicopter TSI ALS Rest of BU’s Current analysis shows net EVA “loss” Rotek and Roshcon are the primary value creators while head office and the telecomms businesses alone destroy more value than is created. 9
We have now reached the end of the business analysis and transformation design phase Business Analysis and Transformation Design (12 weeks) Implementation Planning Scoping Analysing 2 3 4 5 6 7 8 9 10 11 12 13 1 Weeks Corporate Strategy Business Unit Strategy Strategy EVA Analysis Value Analysis Business Case Organisation Design and Development Org Design Scoping Organisation Design Mgmt Profiling Scoping Management Profiling Bal. Scorecard - Draft Balanced Scorecard Development (Level 1 – 3) Transform. Enablement Comms baseline & readiness Ongoing Communications Roll-out Project Management EE Initiative MIS 11
The implementation will require effort and focus for the next 12-18 months Analysis & Design(12 Weeks) Implementation(12-18 Months) • Strategy Analysis: • Corporate • Business Unit • Value Analysis • Strategy Implementation: • Focus on core business • Develop business unit strategies • Realise divest opportunities • Organisational Implementation: • Populate new structure • Develop / align key business processes • Build new functions (NED&M, Globalisation) • Restructure corporate services • Develop required competencies and HR processes • Organisation Impact: • Organisation Design • Management Skills • Enablers: • Balanced Scorecard • Comms & Mobs • (MIS) • Transformation Enablement • Measurement and tracking – BSC implementation • Enabling infrastructure • Systems support • Communication & Mobilisation We are here Business Case Realisation Business Case for Change 12
We have agreed some key principles by which to define EE’s strategic focus Key Principles • Eskom Enterprises must critically evaluate its core business and build focus around this • The design, build, operation and maintenance of Generation, Transmission and Distribution infrastructure is currently EE’s core business • We will focus on business segments where Eskom Enterprises can build strong strategic positions in attractive markets 14
Going forward, EE should focus on core activities, and operate primarily within SADC, Africa and Middle East Core, 2nd Priority, 3rd Priority Core Business Focus SADC SA / Eskom Generation Transmission Design Operate Maintain Build Distribution Priority 1 Priority 2 Priority 3 Core How should EE treat non-core businesses going forward? 15
Analysis has shown that the further we stray from our core, the less likely we are to create value Services vs. Markets Other Services Positive EVA Negative EVA Energy Related Energy Eskom South Africa ROW Despite investment attractiveness or performance, should we divest out of non-core assets? 16 Note:1. EVAs repeated across regions and not across segments; 2. An EVA calculation has not been performed for the SNO; 3. An operating profit has been used to size Enerweb and arivia.kom.
The SADC capacity expansion presents a huge opportunity for EE but highlights timing and capability issues 18 Source: Generation & Transmission Expansion Plan – Budget for Pre-feasibility and Feasibility studies – Bain McIntyre; Focus Interview with Steve Lennon & Andrew Etzinger. Note: An exchange rate of R8 to $1 has been used to estimate the cost of each project.
The upcoming capacity expansion could result in massive growth of EE’s defined core business First Wave of Capacity Build Projects The first wave of the capacity expansion will result in build and refurbishment projects worth R113bn. EE can potentially benefit from feasibility studies, design and project management relating to new builds and parallel refurbishment activity. 19 Source: Generation & Transmission Expansion Plan – Budget for Pre-feasibility and Feasibility studies – Bain McIntyre; Focus Interview with Steve Lennon & Andrew Etzinger. Note: An exchange rate of R8 to $1 has been used to estimate the cost of each project.
EE currently enjoys strong market share positions in many of its core markets Core businesses contribute 62% of EEs current revenues Market Size and Share in SADC - 2002 Market Size (Rm) Market Share (%) Generation Transmission Distribution Can EE maintain these market shares as new players enter the market during the capacity expansion ? 20 Source: Gemini Analysis; Focus Interviews with Generation, Transmission, Distribution Procurement Managers.
EE’s current weak position in generation design and build means we may not fully benefit from the SADC capacity expansion Percentage of Activity Offered, Percentage Share of ER Procurement in Offered Activities Design Build Operate Maintain & Refurbish % of the segment we’re active in Generation % share of the segment we’re active in % of the segment we’re active in Transmission % share of the segment we’re active in % of the segment we’re active in Distribution % share of the segment we’re active in The challenge is to identify the attractive services in the generation design and build segments and to build or buy required capability and capacity. 21 Source: Gemini Analysis; Focus Interviews with Generation, Transmission, Distribution Procurement Managers and interviews with TSI, Rotek, Roshcon and TAP management.
EE’s ability to grow is limited by a shortage of some critical skills Not all service areas are necessarily attractive – EE must focus on adjacencies to current offerings and substantial, sustainable profit pools. 22
Start of construction of Braamhoek, Steelpoort and FBC projects Start of construction of CCG1 & 2 projects The phasing of these projects has implications for resource planning and our ability to commit to international projects Phasing of Additional Capacity Expansion Projects After 2010, further growth will result from the Mepunda Uncua and Western Corridor projects. The core BUs will need to start ramping up capacity now to position themselves for the future, and sell any surplus capacity both within SA and internationally. 23 Source: Generation & Transmission Expansion Plan – Budget for Pre-feasibility and Feasibility studies – Bain McIntyre; Focus Interview with Steve Lennon & Andrew Etzinger. Note: An exchange rate of R8 to $1 has been used to estimate the cost of each project.
Feasibility studies, preliminary design, and project management are worth R7,7bn of the pre-2010 expansion Spend in Sub-Segments and Adjacencies to EE’s Current Focus Detailed design at 2% of the project costs equates to approx. R2.6 bn within the same time period These activities are closest to EE’s current capabilities and should be investigated for potential expansion. 24 Source: Generation & Transmission Expansion Plan – Budget for Pre-feasibility and Feasibility studies – Bain McIntyre; Focus Interview with Steve Lennon & Andrew Etzinger. Note: An exchange rate of R8 to $1 has been used to estimate the cost of each project.
EE’s potential future revenue is made up of work covered by ER’s current level of operational expenditure and new project spend Sources of EE’s Future Revenues (2004-2010) R3,7bn Capacity expansion spend EE’s potential expansion areas R4bn Capacity expansion spend in EE’s current capability areas Revenues R3,8bn Planned refurbishment and expansion R6,5bn ER operational spend with EE1 Sources 25 1. Based on current spend values, as obtained from Gx, Tx & Dx Procurement, with no annual growth.
The SADC capacity expansion represents a major opportunity for the support services business of Eskom Enterprises Building a strong global partnership could dramatically strengthen EE’s position. 27
International projects should be pursued to cover excess capacity in the short-term, allowing us to build expertise ahead of the curve International sales of design, build and maintain services We must scale up while maintaining market share 28
Result in expansion into a non-core area of business: Outside the ‘design, build, operate, maintain’ value chain Outside SADC AND Result in a contractual obligation of greater than 6 months: Including new joint venture agreements / strategic partnerships OR Result in cash outflows (investment or operational) of a sum greater than R500 000 OR Together with any related expenditure or action will result in one of the above Principles: Decisions must be driven by business cases and resource availability Core business must take priority (SADC design, build, operate and maintain; West Africa, and Middle East) Adjacency to the core business must be a key deciding factor: Extent of leverage of existing resources and customer relationships All business cases must include appropriate risk assessment The decision making process time should be driven by due process and not act as a bottleneck EE must take efficient central control of key business portfolio decisions for an interim period If the expenditure / action will … It should be referred to the EE Executive Committee 29
4,000 3,500 3,000 Gesco 2,500 Rand Millions TAP 2,000 TSI Roshcon 1,500 Rotek 1,000 500 - 2010 2003 2004 2005 2006 2007 2008 2009 Under these assumptions, core Support Services revenue will double by 2010 Support Services Revenues 2003-2010 1 31 1. 50% in 2003, 100% thereafter.
Strategy: ‘globalise’ in SADC countries in the short to medium term, West Africa and Middle East in the medium-long term Globalisation (operate segment) EE can potentially support the capacity expansion programme by securing strategic interconnected ‘operate’ contracts. 33
Different strategies need to be adopted based on BU / segments performance and their fit with the EE portfolio Strategic Options: Core Critical Non-Core Non-Critical 35 Note: Performance has been determined by an EVA calculation, where no EVA has been done net operating profit has been used to determine performance.
For each business identified as a potential ‘sale’ opportunity, we followed a process to arrive at a range of realisable values Understand current financials Identify external data Estimate ‘possible’ values1 Understand limitations / implications Determine range of realisable values • Turnover • EBIT • EBITDA • Net profit • Asset base • DCF value (excluding debt) • External valuation • Previous offers made • Industry PE ratios • Multiple of EBITDA • Multiple of net earnings • Value based on assets • Previous offers • External valuation • Contractual commitments (penalty clauses) • Political commitments • Best case • Worst case • Estimate based on current information available 1. Value benchmarks are calculated based on percentage ownership. 36
Cash required to operate Capital required to fund growth in short term Capital required for new projects Capital released through divestments R Eskom Group has agreed to a capitalisation number for EE as a whole, based on key assumptions within each of the pillars • Support Services takes advantage of major opportunities presented by ER build programme • Additional capability is required: • Develop internally • Buy-in • JV / strategic partnerships Support Services Globalisation Non-core Portfolio (NED&M) Head Office Overheads • EE will focus its globalisation efforts within SADC • EE will continue to operate the projects already signed • EE will divest from most non-core businesses • Critical non-core services will be operated as cost centres (no cash effect) • No investments in new business will be made • Head Office costs are controlled and are assumed to be a fixed percentage of Support Services revenue Capitalisation Requirements + - + = 38
Cash generated by core businesses and sale of non-core assets will be used to fund Globalisation growth Total EE Projected Cash Flow – Base Case Including Proceeds for Sale of Asset (Base Case) 39
The 3 pillars were defined in line with strategic developments and are supported by key corporate functions CEO Corporate/ internal services • Finance • HR • Strategy & Transformation • Legal & Compliance Support Services Globalisation NED & M • To provide support services for the Energy Supply Industry • To identify potential opportunities fordeveloping Eskom product and service offering internationally • To manage the operation of these projects once they are operational • Identify “new” opportunities that leverage existing technologies, capabilities or assets • To initiate and incubate the venture start-up for future handover or sale 41
We have agreed to move towards a single Support Services (Pty) Ltd. The business model of Support Services will need to be aligned to serving Eskom as the primary customer. Support Services(Pty) Ltd. TSI (Division) Rotek Engineering (Division) Roshcon(Division) (RVS) (Roshprop) • Focus on core business • Clean out non-core activities • Locate activities where they best belong • Support the ER build program This implies that non-core activities will need to be cleaned out, and other activities repositioned within Support Services. 42
This Support Services structure needs to move away from traditional Business Unit lines and towards an integrated service offering EE Support Services(Pty) Ltd. Internal Services Engineering Consulting (TSI) Maintenance (Rotek Engineering) Construction (Roshcon) R&D (TSI) Implementation implications: • Conduct a complete review of policies and terms of employment for both EE and Rotek • Clearly define criteria by which investment / selling decisions are made: • Which products and services to which markets? • Renegotiate long term enabling agreements with ER for guaranteed baseload • Appoint the ED to act as a single point of control over all support services and take responsibility for the strategic relationship with ER • Design and implement mechanisms for monitoring customer satisfaction and implementing corrective action • Determine the strategic focus of Support Services, and stick to it • Strip out non-core business and position it where it belongs • Change board composition at Rotek to enable greater strategic direction and input from EE • Collapse the dual board structure within Rotek (if Roshcon is to remain within Rotek) • Review limits of authority and board mandates to ensure adequate control from EE • Implement standardised reporting to enable measurement and alignment 43
Globalisation will further the international aspirations of the Group, primarily focusing on the SADC region Globalisation Market intelligence and IP management Marketing and relationship building Opportunity identification Opportunity analysis Deal structuring & closure Operational oversight • Primarily driven by EH needs • High level assessment • Detailed business case: • Coordinate multi-disciplinary teams with necessary expertise • Coordinate the deal team with support from finance • Market intelligence management • Coordinate and manage intellectual property • Document ‘Eskom Way’ and customise for other countries • Develop operating methodology for target countries (e.g. tax, legal, HR, etc.) • Maintain operational oversight of projects • Focused business development 44
The high level structure for Globalisation is defined however it’s size will be determined by the Globalisation strategy and focus areas Globalisation Intellectual Property and Market Intelligence Manager Regional Business Development Manager Operations Oversight Manager Implementation implications: • The detailed Globalisation structure will be populated when the Globalisation strategy has been formulated and the business processes required to support the function have been defined • Given the processes and the volume of work, the size of the team will evolve • Key processes to support this function will include: • Resource allocation • Business case • Opportunity identification and identification • These process will be designed as part of the implementation 45
New ventures should be developed primarily for sale or handover to other areas of the business Other associated or adjacent business opportunities will be pursued by NED&M on a project basis, driven by Group opportunities and needs New Enterprise Development & Management Opportunity identification Opportunity analysis Deal structuring & closure Portfolio management Market Intelligence input from Globalisation • New ventures which leverage existing capabilities, assets and / or technologies • Initial high level assessment and business case • Assess the opportunity with multi-disciplinary team • Coordinate the deal team with support from finance • Identify and develop potential JVs and strategic partnerships • Incubate new ventures • Manage assets for value as part of a balanced portfolio • Implement investment / divestment decisions 46
Both Globalisation and NED&M will need strong corporate finance support in the structuring of new deals and projects Corporate Finance Globalisation Market intelligence and IP management Marketing and relationship building Opportunity identification Opportunity analysis Deal structuring & closure Operational oversight New Enterprise Development & Management Opportunity identification Opportunity analysis Deal structuring & closure Portfolio management Market Intelligence input • Deal structuring • Negotiation • Risk assessment • Business case development and assessment • Funding • Tax implications 47
Some of these skills will be accessed externally and coordinated by this office due to the specialised, deal specific resources needed Therefore a strong CFO function is recommended to provide traditional finance as well as a corporate finance capability Chief Financial Officer (CFO) • Finance & Control • Financial and management accounting • Risk management • Tax and audit • Pension and provident administration • Financial reporting • Corporate Finance • Business case-based opportunity assessment • Risk assessment and management • Deal structuring • Deal negotiation and closure Treasury / Funding • Other functions • Third party relationship management • Financial system management 48
We recommend a clear differentiation of Corporate and Operational services CEO Support Services Globali-sation NED & M Finance& Services HR Legal & Compliance Strategy and Transformation* Corporate Services Internal Services Head Office Operational Services Trust and service orientation provide the foundation for the new operating environment. 49