Download

1 / 11
120 likes | 165 Vues
Explore seismic waves, seismographs, & earthquake magnitudes. Learn how to pinpoint epicenters & measure quake energy. Follow lab instructions.

E N D
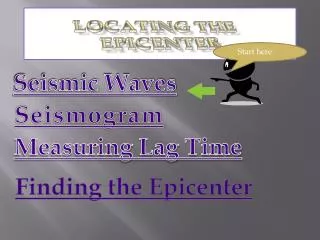
Finding the Epicenter …I hope you really like graphs!
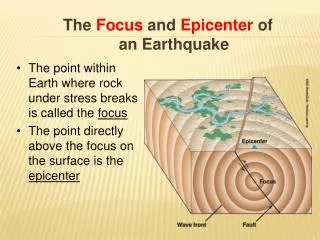
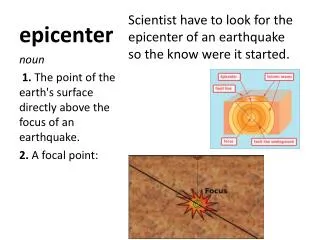
Event of an Earthquake Recap The Epicenter is the spot on the ground directly above where the earthquake occurred under the ground
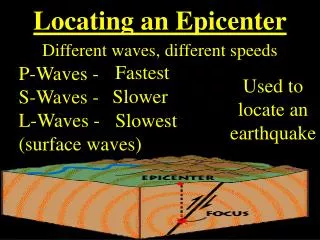
When an earthquake occurs, it sends out seismic wave energy in all directions. There are three main waves that form: P-Waves, S-Waves and Surface Waves. Each Wave moves the ground differently (as the picture shows above). The P waves always move fastest, then the S-waves and last is the Surface waves. Surfaces waves are so slow because they only travel on the surface of the planet but P & S waves can go right through the middle making their distance/time shorter.
A seismograph is a machine that makes up and down wave lines on a moving paper as the ground moves under the machine. The more the ground moves, the more the paper moves. The more the paper moves, the bigger the up-down lines will be drawn. The seismograph shows the three different seismic waves generated by an earthquake. How a seismograph works
This chart shows that there are multiple Seismograph stations around the world that will measure an earthquake when the Seismic wave energy passes by. The farther away a station is the longer the actual graph will be and the shorter the waves will be drawn. But we are able to make measurements from the information on the graph to tell how far away an earthquake came from.
A station cannot tell the direction an earthquake came from, but if we use the info from multiple stations, we can pinpoint the actual location of the quake. They draw a circle with a diameter equal to the distance away an earth was measured to be. All 3 circles will only meet at one exact spot on a map. This spot is the location of the Earthquake!
Earthquakes are measured by “Magnitude” which measures how “large” the quake is. • Basically, the larger the “squiggle” in the seismogram, the greater the magnitude. • Once you know the distance from an earthquake, and the amplitude of the seismogram, you can find the magnitude!
As we go up in magnitude, the amount of energy released dramatically increases! Look at this chart of magnitude and how the energy released can be compared…the greater the magnitude of the quake, the more potential damage it can do. The biggest possible earthquake we can conceive of is measured at a magnitude of 10! The biggest we have recorded are in the 9.4 range. These are very rare!
Use this link to go to the website for the lab and follow the instructions given in the packet: • http://www.sciencecourseware.org • You will need your packet!!!