Download
1 / 27
290 likes | 580 Vues
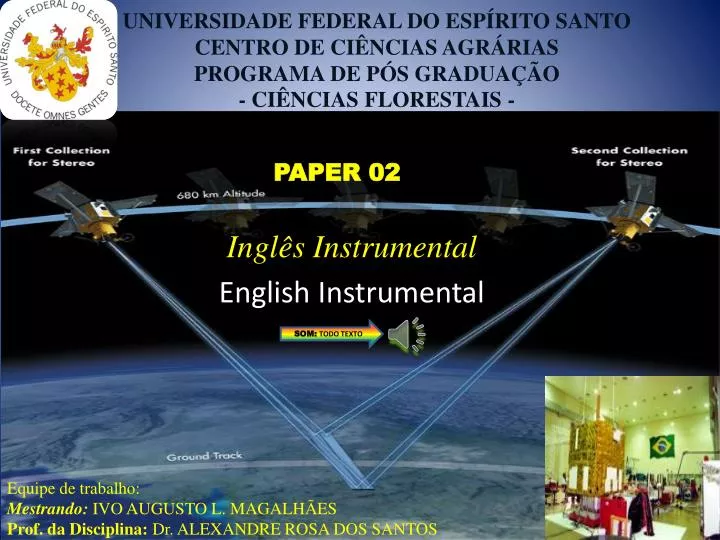
PAPER 02. UNIVERSIDADE FEDERAL DO ESPÍRITO SANTO CENTRO DE CIÊNCIAS AGRÁRIAS Programa de Pós Graduação - Ciências Florestais -. Inglês Instrumental English Instrumental. SOM: TODO TEXTO. Equipe de trabalho : Mestrando: IVO AUGUSTO L. MAGALHÃES

E N D
PAPER 02 UNIVERSIDADE FEDERAL DO ESPÍRITO SANTOCENTRO DE CIÊNCIAS AGRÁRIASPrograma de Pós Graduação - Ciências Florestais - Inglês Instrumental English Instrumental SOM: TODO TEXTO Equipe de trabalho: Mestrando:IVO AUGUSTO L. MAGALHÃES Prof. da Disciplina: Dr. ALEXANDRE ROSA DOS SANTOS
ALFABETO ANTES DE INTERAGIR COM TEXTO E SOM DOS PAPERS DA DISCIPLINA LEIA E OUÇA O ALFABETO ab cdefghi jklmnopqrstuvwxyz SOM: TODO TEXTO
“CLASSIFICAÇÃO DE IMAGENS LANDSAT E IRS: AVALIAÇÃO DA CLASSIFICAÇÃO NÃO-SUPERVISIONADA E SUPERVISIONADA PELA BANDA RAZÕES E DEM EM UMA PAISAGEM MONTANHOSA DO NEPAL” “LANDSAT AND IRS IMAGE CLASSIFICATION: EVALUATION OF UNSUPERVISED AND SUPERVISED CLASSIFICATION THROUGH BAND RATIOS AND DEM IN A MOUNTAINOUS LANDSCAPE IN NEPAL” SOM: L1 SOM: L2 SOM: L3 SOM: L4 SOM: TODO TEXTO KrishnaBahadur K.C. Remote SensingVol. 1, pag.1257-1272, 2009. SOM: L5 PALAVRAS CHAVES Classification Mountainous Landscape SOM: P2 SOM: P1 SOM: P3
Introdução Introduction SOM: TODO TEXTO SOM: L1 • Remote sensing • Land use • Accuracy of subjects • Mountainous areas • Plant species • Sensoriamento remoto • Uso da Terra • Precisão dos temas • Áreas montanhosas • Espécies vegetais SOM: L2 SOM: L3 SOM: L4 SOM: L5 SOM: L6
Introduction • Modelo Digital de Elevação • Resolução espacial da Imagens Landsat • Resolução espacial do satélite Indiano • Topografia • Período em estiagem • Mínima presença de nuvens • Resposta espectral SOM: TODO TEXTO • Digital Elevation Model • Spatial resolution Landsat image • Spatial resolution of the Indian satellite • Topography • Period in dry • Minimal presence of clouds • Spectral response SOM: L1 SOM: L2 SOM: L3 SOM: L4 SOM: L5 SOM: L6 SOM: L6
ObjetivosGoals SOM: L1 O objetivo do estudo foi avaliar a utilização do RATIO de bandas espectrais, e os dados de elevação na imagem Landsat e IRS , para produzir um mapa temático de uso do solo da bacia Galaudu do Nepal The aim of this study was to evaluateRatio of spectral bands, and the datalift Landsat IRS and to produce a thematic map of land use Galaudu basin of Nepal
MATERIAIS E MÉTODOS MATERIALS AND METHODS SOM: L1 LOCALIZAÇÃO DA ÁREA DE ESTUDO Divisor de água na Cadeia montanhosa de Galaudu Pokhare Khola sub-bacia Distrito de Dhading do Nepal LOCATION OF STUDY AREA Mountain GalauduPokhareKhola sub-watershed Dhadingdistrict of Nepal SOM: L2 SOM: L3 SOM: L4 SOM: L5 SOM: TODO TEXTO
Materiais e métodosMaterials and methods SOM: L1 • Dados do multiespectrais Landsat (MSS), (TM) e IRS • Fotografias aéreas de 1:50.000 e mapas de 1:25.000 • Curvas de nível equidistante de 20 m SOM: TODO TEXTO • Data from Landsat multispectral(MSS), (TM) e IRS • Aerial photographs of 1:50.000 • Contoursequidistantof 20 m SOM: L1 SOM: L2 SOM: L3
Materiais e métodosMaterials and methods • Registro das imagens por pontos de controle • RATIO • NDVI e PCA • Filtro mediano de 3x3 • ERDAS 8.7 e ArcView 3.2 SOM: TODO TEXTO SOM: L1 • Registration of images by Control Points • RATIO • NDVI and PCA • Medianfilterof 3x3 • ERDAS 8.7 andArcView 3.2
FLUXOGRAMA DE ESTUDOFLOWCHART OF STUDY SOM: TODO TEXTO
Materiais e métodosMaterials and methods SOM: L1 • Calibração Atmosférica • Correção Radiométrica • Registro da imagem • Definição das Classes Temáticas • Classificação ISODATA e BAYESIANO • Calibrationatmospheric • CorrectionRadiometric • Registrationoftheimage • DefinitionofThematicClasses • ISODATA ClassificationandBAYESIAN PALAVRAS CHAVES SOM: TODO TEXTO ISODATA BAYESIANO SOM: P2 SOM: P1
ResultadosResults SOM: P1 Os valores médios espectrais encontrados para diferentes classes de uso da terra mostram que aclassificação contendo apenas bandas originais não atingem uma maior precisão, já que apenas o solo nu e as florestas foram distinguíveis As Características conjuntas contendo NDVI teve maior precisão no que diz respeito à vegetação devido o NDVI responder o mais alto para a vegetação e a menor em solo descoberto e campo queimado The mean values found for different spectral classes of land use show that the classification containing only original bands do not reach a higher precision, since only the bare soil and the forests were distinguishable Featured joint containing NDVI had greater precision with respect to the vegetation due to meet the highest NDVI for vegetation and bare soil and lower in burned field. SOM: PARÁGRAFO 1 SOM: PARÁGRAFO 1 SOM: TODO TEXTO
ResultadosResults SOM: P1 A classe mista entre mato e floresta foi melhorada devido o RATIO das bandas na proporção de 5 e 2, 5 e 4 e 5 e 7 The mixed class between forest and forest was improved by the RATIO of the bands at a ratio of 5:02, 5:04 and 5 and 7 Classes de vegetação obtidos a partir de estas combinações deu a maior precisão. A precisão da classificação geral variou de 45-68 por cento para as técnicas não supervisionadas Vegetation classes obtained from these compounds has the highest accuracy. The overall classification accuracy ranged from 45-68 percent for unsupervised techniques SOM: PARÁGRAFO 1 SOM: PARÁGRAFO 1 SOM: TODO TEXTO
ResultadosResults SOM: P1 Entre os doze esquemas de classificação para TM, e seis para MSS e IRS inclusão do DEM como banda componente nos esquemas de classificação mostrou muito resultados promissores, pois ajudou a diferenciar os tipos de vegetação, tais como tipos de floresta que de outra forma não é possível se diferenciar com NDVI devido a assinaturas semelhantes Among the twelve classification schemes for TM, and six for MSS and IRS inclusion of DEM as a band component in the classification schemes showed very promising results, it helped to differentiate the types of vegetation such as forest types that otherwise is not possible to differentiate with NDVI due to similar signatures Tipos de vegetação, solo exposto e áreas de cultivo de sequeiro foram discriminados utilizando a combinação de três bandas relação diferente (4/3, 5/4, 5/7) que deu a maior precisão Vegetation types, bare soil and dryland farming areas were discriminated by using a combination of three bands different relationship (4/3, 5/4, 5/7) which gave the highest accuracy SOM: PARÁGRAFO 1 SOM: PARÁGRAFO 1 SOM: TODO TEXTO
ResultadosResults SOM: P1 Combinações de sistemas de banda ratio foi selecionado para a classificação supervisionada, porque esta esquema deu o maior rigor na classificação não-supervisionada Combinations of band systems ratio was selected for the supervised classification, because this scheme has the highest accuracy in the unsupervised classification Um precisão mapa global (OCA) de 94,08 por cento foi obtida através da matriz de erro das assinaturas de treinamento. Como a avaliação precisão pós-classificação, uma OCA de 82,86 por cento e coeficiente kappa de acordo (khat) estatísticas de 0,74 (Tabela 3) foram obtidos para a imagem classificada.(Tabela 3). A global map accuracy (OCA) of 94.08 percent was obtained from the error matrix of the training signatures. As the post-classification accuracy assessment, an OCA 82.86 percent and kappa coefficient of agreement (khat) statistics of 0.74 (Table 3) were obtained for the classified image(Table 3). SOM: PARÁGRAFO 1 SOM: PARÁGRAFO 1 SOM: TODO TEXTO
Resultados - Results SOM: P1 • FOREST • SCRUB • UPLAND AGRICULTURE • LOWLAND • AGRICULTURE • PRODUCER'S ACCURACY • FLORESTA • MATOS • AGRICULTURA DE SEQUEIRO • VÁRZEA • AGRICULTURA • PRECISÃO DO PRODUTOR SOM: L1 SOM: L2 SOM: L3 SOM: L4 SOM: L5 SOM: TODO TEXTO SOM: L6 Tabela 3. Matriz de erro do mapa de classificação supervisionada de Galaudu, Nepal.
ResultadosResults SOM: P1 Os resultados mostram que a área da floresta diminuiu, enquanto a área agrícola aumentou continuamente ao longo do período de estudo. Matos (degradado floresta de terra) foram avaliados em 1976, mas eles já foram convertidos para o bom estado das florestas em 1990, enquanto várzea área agrícola se expandiu muito durante o primeiro período enquanto área de agricultura de sequeiro foram expandidas muito no último período (Tabelas 4). The results show that the forest area decreased while the agricultural area increased steadily throughout the study period. Matos (degraded forest land) were evaluated in 1976, but they have been converted to the proper state of forests in 1990, while lowland agricultural area has expanded during the first period as an area of dry farming were expanded greatly in the last period (Table 4). SOM: TODO TEXTO
ResultadosResults SOM: TODO TEXTO SOM: P1 • FOREST • SCRUB • UPLAND AGRICULTURE • LOWLAND • AGRICULTURE • PRODUCER'S ACCURACY • FLORESTA • MATOS • AGRICULTURA DE SEQUEIRO • VÁRZEA • AGRICULTURA • PRECISÃO DO PRODUTOR SOM: L1 SOM: L2 SOM: L3 SOM: L4 SOM: L5 SOM: L6 Tabela 4. Uso e ocupação da terra da bacia hidrográfica Galaudu, Nepal, 1976, 1990 e 2000.
ResultadosResults SOM: P1 Entre as classes principais de uso da terra, cerca de 65% da agricultura de sequeiro, 52% das terras baixas agricultura e 45% da área florestal em 1976 permaneceu inalterada até 2000. As áreas florestais tiveram um desmatamento de aproximadamente 55% de 1976 e 2000 (Tabela 5). Among the major classes of land use, about 65% of rainfed agriculture, 52% of lowland agriculture and 45% of forest area in 1976 remained unchanged until 2000. The forest had a deforestation of approximately 55% in 1976 and 2000 (Table 5). SOM: TODO TEXTO
ResultadosResults SOM: P1 Tabela 5. Variação percentual no uso e ocupação da terra durante os três períodos, bacia Galaudu, Nepal.
DiscussõesDiscussion SOM: P1 A expansão da área agrícola da planície durante o primeiro período à custa de terras altas indicaram o aumento da intensificação agrícola e diversificação de culturas durante o período. A partir de conversas com os agricultores locais foi revelado que houve de fato uma grande mudança no padrão de uso das terras baixas durante este período porque das atrações dos agricultores no sentido de cultivo de inverno, principalmente de trigo e batata em terras irrigadas . The expansion of the agricultural area of the plain during the first period at the expense of the highlands indicated the increase of agricultural intensification and diversification of crops during the period. From conversations with local farmers was revealed that there was indeed a great change in the pattern of use of the lowlands during this period because of the attractions of farmers to winter crop, mainly wheat and potatoes on irrigated land . SOM: TODO TEXTO
DiscussõesDiscussion SOM: P1 O cultivo de batata para fins comerciais tem dinâmica adquirida nas terras baixas, devido principalmente a um maior acesso aos mercados locais e superiores rentabilidade em comparação com o trigo e outros cereais. The cultivation of potatoes for commercial purposes has gained momentum in the lowlands, mainly due to greater access to local markets and higher profitability in comparison to wheat and other cereals SOM: TODO TEXTO
Conclusão Conclusion SOM: P1 O sensoriamento remoto tem se tornado uma importante ferramenta para o monitoramento e gestão dos recursos naturais recursos e meio ambiente. Remote sensinghasbecomeanimportanttool for monitoringand management of natural resourcesandenvironmentalresources. SOM: PARÁGRAFO 1 Um dos principais problemas na geração de mapas de uso da terra , é a confusão de respostas espectrais com características diferentes. A major problem in the generation of maps of land use, is the confusion of spectral responses with different characteristics. SOM: PARÁGRAFO 1 Discriminação da terra uso da terra cobrir os tipos, incluindo tipos de vegetação através da utilização de técnicas de sensoriamento remoto em zonas montanhosas áreas de Nepal é uma tarefa muito difícil, devido à estrutura complexa e composição da vegetação comunidades Breakdown of land use land cover types, including types of vegetation by using remote sensing techniques in mountainous areas of Nepal is a very difficult task due to the complex structure and composition of vegetation communities SOM: PARÁGRAFO 1 SOM: TODO TEXTO
Conclusão Conclusion SOM: P1 Neste estudo, a melhora na classificação de diferentes tipos de vegetação, incluindo as terras altas de áreas agrícolas na bacia Galaudu, Nepal, foi explorado pelo uso supervisionado e não supervisionado de técnicas de classificação. In this study, the improvement in classification of different types of vegetation including upland agricultural areas in the basin Galaudu, Nepal, was explored by the use of supervised and unsupervised classification techniques. SOM: PARÁGRAFO 1 O método de classificação supervisionado apresentou maior precisão do que o método de classificação não-supervisionada The supervised classification method showed higher accuracy than the method of unsupervised classification. SOM: TODO TEXTO SOM: PARÁGRAFO 1
Vocabulário - Vocabulary SOM: P1 SOM: P2 SOM: P3 SOM: P4 SOM: P5 SOM: P6 SOM: P7 SOM: P8 SOM: P9 SOM: P10 SOM: P11 SOM: P12 SOM: P13 SOM: P14 SOM: TODO TEXTO
Muito Obrigado pela Atenção !!! THANK YOU FOR ATTENTION !!! SOM: TODO TEXTO Contact: ivosrmagalhaes@gmail.com