Download
1 / 29
290 likes | 461 Vues
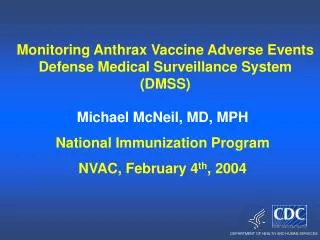
Monitoring Adverse Events in Surgery. Steve Gallivan Clinical OR Unit University College London. Principal Collaborators. Jocelyn Lovegrove (Ex-CORU) Chris Sherlaw-Johnson (CORU) Tom Treasure (Cardiac Surgeon) Jaroslav Stark (Paediatric Cardiac Surgeon)

E N D
Monitoring Adverse Events in Surgery Steve Gallivan Clinical OR Unit University College London
Principal Collaborators • Jocelyn Lovegrove (Ex-CORU) • Chris Sherlaw-Johnson (CORU) • Tom Treasure (Cardiac Surgeon) • Jaroslav Stark (Paediatric Cardiac Surgeon) • Marc de Leval (Paediatric Cardiac Surgeon)
Cumulative perioperative mortalities 10 Expected mortality (from risk model) 8 Actual mortality Par for the 6 course 4 Net life 2 gain 0 0 10 20 30 40 50 60 70 80 90 100 110 120 130 140 150 Operation number Calculating Net Life Gain based on pre-operative risks
Unexpected Net life gain 5 death Surgeon A 4 Surgeon B 3 Surgeon C 2 1 Survivor 0 against -1 the odds -2 -3 -4 0 10 20 30 40 50 60 70 80 90 100 110 120 130 140 150 Operation number Comparing three fictitious surgeons
(%) Net life gain 15 99 95 10 90 75 5 50 0 50 75 -5 90 95 -10 99 -15 50 100 150 200 250 300 350 400 Operation number 6 more survivors than predicted for the case mix. Within 90% interval Displaying probability that divergence a result of chance
Net lives saved VLAD plot for a professor of cardiac surgery
VARIABLE LIFE ADJUSTED DISPLAY - CABG VLAD plot comparing Bristol with another cardiac centre
Difficulties using VLAD for paediatric cardiac surgery • Many different types of procedure • Operation may involve several procedures • Surgeons perform relatively few operations of the same type • Mortality standards not established • No accepted risk scoring system
Monitor performance + Compare surgeons Change emphasis Early identification of periods of divergent outcome
Mortality rates for 11 paediatric cardiac surgeons (1 year data)
Partial risk strata Surgeon’s own mean mortality Surrogate pre-operative ‘risk’ forecast Risk model tailored to surgeon’s own mean mortality rate
Complexity Profile 100 80 Tom CumulativePercentage 60 Dick 40 Harry 20 0 1 2 3 4 5 6 Operation Difficulty
100 80 60 Cumulative percentage 40 Divergent period Rest of period 20 0 1 2 3 4 5 6 Complexity Category (increasing complexity)
Case study 2 A heart transplant centre audits its recent outcome and discovers that there have been 5 deaths out of the most recent 14 operations. Should the service be suspended?
KEY QUESTION What is probability that a binary sequence length M has a sub-string length N with at least K ones? [Probability that i-th bit is one = qi] SURELY FELLER ANSWERED THIS!
N Most recent 6-string Number of ones 1 0 0 2 01 1 3 010 1 4 01001 2 5 010010 2 6 0100101 3 7 01001011 3 8 010010110 3 9 0100101101 4 10 01001011010 3 11 010010110101 4 12 0100101101011 4 13 01001011010111 4 14 010010110101111 5 EVOLUTION OF BINARY STRINGS
Recurrence relationship for evolution of probabilities for binary string b from the set HMK f1(b) and f2(b) the two progenitors of b
Probability of a run with 5 deaths out of a subsequence of 14