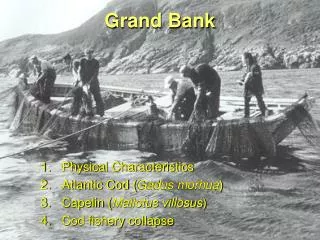
Grand Bank
Grand Bank Physical Characteristics Atlantic Cod ( Gadus morhua ) Capelin ( Mallotus villosus ) Cod fishery collapse Hypothetical marine fish

Grand Bank
E N D
Presentation Transcript
Grand Bank • Physical Characteristics • Atlantic Cod (Gadus morhua) • Capelin (Mallotus villosus) • Cod fishery collapse
Hypothetical marine fish • Hypothetical population with an annual survival rate of 50% and initial reproduction at age 3. This population produces an average of 166 eggs per recruit. • # eggs spawned = fish age * mature proportion * average fecundity at that age • # eggs per recruit = total # eggs spawned / initial population size
Maturity schedule and average fecundity at length for a hypothetical population Proportion mature Fecundity Fecundity Proportion maturing Age(years)
Hypothetical marine fish species:50% survival per year after recruitment
If fishing reduced survival to 25% per year, the average would drop to 29 eggs per recruit; only 17.5% of the unexploited population’s production.
Month J F M A M J J A S O N D J F 10 0 5 1 Depth in meters 175 150 125 100 75 50 25 0 -1 3.7 km off Cape Spear, 1950-1962 Grand Bank ocean temperature “As cold as a cod’s nose”
Atlantic Cod (Gadus morhua) • Gadid • ~20 year life span • offshore and inshore stocks • Migrate inshore to feed on capelin • Enter the fishery at age 3-5, depending on latitude
Atlantic Cod • Distribution and Population Structure • Distribution: Cape Hatteras, N.C. to Baffin Island and Greenland in NW Atlantic. Many stocks, with distinct feeding and spawning areas. Northern cod are viewed as a complex or a collection of related stocks.
Atlantic Cod • General Migratory pattern: • Winter - offshore near shelf break (200-600 m, 4-6 C). • Summer - Inshore, widely dispersed, following capelin. • Inshore/offshore migration avoids lethally cold winter temps • (-1.0 to -1.5 C). However, some cod stay inshore all winter, and they secrete antifreeze protein in blood.
Atlantic Cod: Winter distribution Post-spawning feeding migration 540 500 460
Atlantic Cod • Reproduction: • Mature about age 6 for females (45-60 cm) • Males mature younger • Northern cod spawn late winter/early spring. Other populations spawn at other times. • Spawn mid-water, closer to bottom than surface • Fecundity: • 2 million for 80 cm cod, 11 million for 130 cm. • Eggs buoyant, 1-2 mm • Hatch at 5 mm, larval cod settle to bottom at 4 cm.
Atlantic Cod • Growth and Feeding: • Young eat copepods, amphipods, and crustacean zooplankton. • Juveniles eat shrimp, amphipods, euphausids, fish, and shellfish larvae. • Adults eat mainly fish, • including about 90% capelin when they come onshore in summer.
Spawning migration of capelin stocks A E B C D
Onshore migration of capelin 0 600 1200 1800 2400 3000 Weekly capelin landings (MT) Tidal Amplitude 0 0.5 1.0 1.5 2.0 2.5 5/31 6/28 7/26 8/23
Onshore winds inhibit cod and facilitate release of larval capelin Onshore Wind Too warm for cod Offshore Wind Too warm for cod Cod prefer 0.5 to 8.5 C; wind-driven waves wash larval capelin off the beaches
Basques (?) John Cabot 1497 1550: 128 vessels Late 1600s ~ 100,000 t/year Late 1700s ~ 200,000 t/year Late 1800s ~ 150-400,000 Fisheries Transitions Handlines Traps Beam trawl Otter trawl Mechanized trawling Offshore trawling 1970s foreign fleet “200 mile limit” History of Cod Fisheries
Cod Fisheries Cod Trap ~ 1780 • Handlines ~ 1840
Cod Fisheries Otter Trawl ~ 1905
Offshore Inshore Foreign 500 450 400 350 300 Commercial Catch, 1000 T 250 200 150 100 50 0 80 85 90 70 75 77 YEAR Foreign and Offshore trawling
Northern Cod catch at age Year Age 2-5 6-10 11-15 16-20
3 1962 2.5 1978 1993 2 % of Population 1.5 1 0.5 0 9 10 11 12 13 Age Elimination of older age classes
Collapse of the cod stocks • In 1992 a complete moratorium was put in place, halting commercial and subsistence fishing for cod over much of their northern range. This caused tremendous hardship for the fishermen and associated communities, and the populations have not fully recovered. At present only very limited fishing is permitted.
Speaking for the FishBrian Tobin, Minister of Fisheries and Oceans, Canada • “Approximately 40,000 fishermen and plant workers who depend on Atlantic groundfish stocks for their livelihood are left without work, and hundreds of coastal communities are devastated economically. • Thousands of Canadians are seeing their way of life disappear. Many live in communities in houses built within 50 yards of saltwater. There are no trees, no minerals, no tourism, no manufacturing base, no information or knowledge-bases industry. There is ready access to a resource, but the resource is gone. • So when we speak for the fish – and we must speak loudly in every forum – we are also speaking for the people – of this and future generations.” • Fisheries 20(7):18-19. 1995
Northern Cod Collapse: was it really overfishing? • Biological Explanations seem unlikely: • Temperature – Recruitment • Decline in prey (capelin) abundance
Why didn’t fisheries managers prevent the northern cod collapse? • Size and age structure declined • Fisheries surveys: CPUE Declined “Catch per unit of effort” • Fisherman reported high catch rates • Over-capitalized fleet supported by unemployment compensation to achieve social goals • Political pressure to keep fishing
Marine Resources and NewfoundlandWilfred Tempelmen 1966 • “In the winter and early spring the inshore waters of the adjacent Newfoundland Area and those of the banks, are so cold that groundfish, chiefly cod, must retreat offshore and to deeper water. Also at this time they gather in prespawning and spawning concentrations. • These dense schools are thus concentrated in the restricted areas of warmer water on the deeper slopes of the bank and shelf areas, where they are readily caught by trawlers. It is thus likely, as apparently occurred with the southern Grand Bank haddock, that as these schools decline under the effects of heavy fishing the spawning groups and the immature of commercial size of a particular stock will continue to concentrate. • This concentration may thus form a school in a smaller and smaller area, and the school will be vulnerable to heavy fishing when it is found. In this case there would be good deep water trawling in winter and spring until the stock has been greatly reduced.”
Prior to 1990 During 1990s Relative abundance Changing community composition and trophic cascade Relative changes in abundance (not to scale) of trophic levels in the Newfoundland-Labrador area. Cod Capelin Zoopl Phytopl Carscadden et al. 2001 CJFAS 58: 73-85
Mean number of capelin per tow during summer research vessel surveys. 1000 100 10 1 Number per tow 1970 1975 1980 1985 1990 1995 2000 Year
Community interactions: cod declined but other species also changed in abundance harp seals Halibut population 0 2 4 6 Cod biomass or seal abundance halibut 100 200 300 400 500 600 cod 1960 1970 1980 1990 Year
Harp seals, traditionally hunted for fur, are now very abundant 2003 – 2005: Canadian sealers were allowed to take 975,000 seals
Changes in annual consumption of capelin by cod and harp seals for selected years between 1964 and 1996. capelin consumed by harp seals capelin consumed by cod Consumption 1964 1974 1984 1996 Year
50 1962 1978 1993 40 30 % of Population 20 10 0 3 4 5 6 7 8 9 10 11 12 13 Age Age Structure of Cod
Reconstructed population estimates of cod recruitment (to age 1) with and without the effects of grey seal predation. with seal predation Recruitment (millions) 0 50 100 150 200 Without seal predation 1970 1975 1980 1885 1990 1995 Year
Vertically integrated temperature (0-176 m) anomalies. 1 0.5 0 -0.5 -1 Mean and 5-yr running average Temperature anomaly 1950 1958 1966 1974 1982 1990 1998 Year Drinkwater et al. 1999