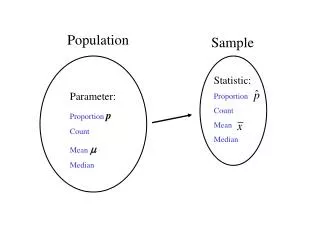
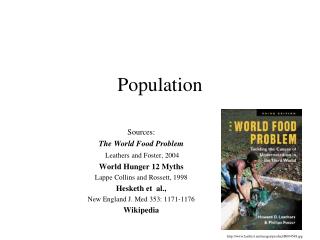
Population
Population. Population Increase. World Population Growth. Where is the increase happening?. Where is the increase happening?. Why did this increase occur?. Agricultural Revolution – more stable food supply, less famines.


Population
E N D
Presentation Transcript
Why did this increase occur? • Agricultural Revolution – more stable food supply, less famines. • Industrial and Scientific Revolutions – better machinery developed for agriculture. Better farming techniques developed. Advances were made in healthcare and medicines which saved more peoples lives.
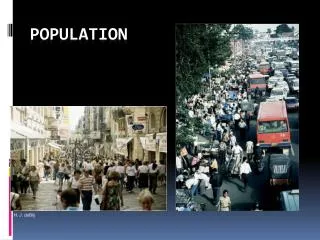
Population Growth • Today, approximately 132 million people are born each year, while only 53 million people are dying each year. Therefore the population of the world is continuing to grow. • The population of countries in Africa and Asia are increasing rapidly, while those in Europe, America, and Japan are increasing slowly. • In some countries such as Germany the population is actually decreasing.
Almost all of the increase in population is taking place in the poorer countries of the south.
The Population Cycle • The population of all countries goes through a population cycle. • There are 5 stages in the population cycle. • Countries move through the different stages of the cycle as a result of their social and economic development.
The Population Cycle – Stages 1-5 • Stage 1: High birth rate, high death rate. Low population growth due to famine, disease, and natural disasters. • Stage 2: The economy improves. Money is spent on healthcare and clean water. Birth rate stays high, death rate drops a lot. Population increases. • Stage 3: Social and economic development continues. People start having less children as most children survive to adulthood. • Stage 4: The country is now wealthy. Family planning is widespread. Low birth rate and death rate. Small population growth. • Stage 5: People have very few children. The death rate is higher than the birth rate. The population starts to decline.
Factors Affecting Population Change • Food Supply Increased food supply allows the population to grow. When people have enough food they are likely to be healthy. • Improved Technology Farming has improved as a result of better machines, the use of fertilizers, and irrigation practices. This has boosted food supply allowing the population to grow. • Health Improved access to safe drinking water decreases diseases such as cholera, typhoid. Improved vaccinations prevent people getting ill allowing them to live longer.
Factors Affecting Population Change • War Millions of people have been killed in wars over the years. During war agriculture, water supplies, and health services are destroyed which also leads to increased death rates. • The Status of Women In wealthy countries women have a high status in society. They have high levels of education and many choose to have careers rather than work in the home. They tend to have less children. In poorer countries many women stay at home and have large families. • Education Education gives people control of their lives, especially women. Educated women plan the size of their families. They learn about good diet, healthcare, and hygiene practices. This reduces illnesses and allows children to grow up healthy.
Factors Affecting Population Change • The Status of Women • When women are educated and involved in careers outside the home they have less children. • This greatly reduces the population growth of a country.
3 ChildrenFamilies After 3 generations there are 27 children being born. 2 ChildrenFamilies After 3 generations there are only 8 children being born.
Factors Affecting Population Change • Education levels – Female Literacy
Future Population Growth??? • If the world’s population continues to increase as it has over the past 50 years, there will be more than 11 Billion people by the year 2040. • However, people in many countries are starting to have fewer children. • Access to clean water, vaccinations, and education are resulting in mothers have smaller families because all of their children are living healthy lives and surviving to adulthood. • Therefore, population growth should fall in the coming years.
Population Pyramid - Germany • What % of Germany’s population is in the age group 15-19 years? • Which age group makes up the greatest % of Germany’s population? • There are more women aged 75-79 years in Germany than men. True or False? • Explain one reason why a small % of Germany’s population is in the age group 0-4 years.
Population Pyramid - Ireland • There are more females than males aged 80-84 years in Ireland. True or False? • Less than 8% of Ireland’s population is in the age group 0-4 years. True or False? • More than 12% of Ireland’s population is in the age group 20-24 years. True or False?
Population Pyramid - Brazil • Which age group makes up the largest % of Brazil’s population? • More than 6% of Brazil’s population is made up of women aged 10-14 years. True or False? • More than 4% of Brazil’s population is in the age group 35-39 years. True or False. • Calculate the % of Brazil’s population aged 20-29 years.
Are Population Pyramids Useful? • Population pyramids show the % of males and females in the different age groups. • They allow governments to plan things like where to build schools, hospitals, and other healthcare facilities. • They also allow government to forecast tax and pension needs.
Population Growth – Is it Good or Bad? • The rapid population growth since 1800, and especially since 1950 has occurred because people are living longer, healthier lives. Less children are dying in the poorer countries because they have more access to food, medicines, and clean water than in the past. • However, this rapid population growth is causing huge problems on our planet. Many people now agree that there are too many people on the planet and that we should try to stop the population from increasing further. • More people on the planet means more environmental damage such as deforestation, desertification, and species extinction. It is also contributing to the problem of global warming.
Population Distribution • Population distribution refers to how people are spread throughout the world. Population distribution is very uneven. • People do not like to live in places that are too hot, too cold, too wet, or too dry. • Population densities are very low in these types of areas.
Population Density • Population density refers to the average number of people living in a square kilometre. • Calculate the population density of the; • - Complete grid. • - Right half of the grid. • - Left half of the grid. • Each grid is 1 km². The number is the number of people living in each grid.
Population Change in the West of Ireland • The population density of the west of Ireland has changed dramatically in the past 200 years. • Before the Famine in the 1840’s the population rose sharply. • During the Famine, many people died or emigrated to the UK or the US. • Emigration continued after the Famine and so the population of the west declined for more than 100 years.
Population Trends – Co. Clare • In which year did the population of Co. Clare reach its highest level? • In which year did the population of Co. Clare reach its lowest level? • Explain 2 reasons why the population of Co. Clare went down. • Calculate the difference between the population in 1821 and 2002. • Explain why the population has increased since 1966 – 2002.
Population Change: Clifden Rural District and Galway • What has happened to the population of Clifden rural district since 1911? • What has happened to the population of Galway since 1911? • Explain two reasons why these changes have taken place. • Suggest one thing that the government could do to stop this pattern from continuing.
Population Density - Dublin • The Dublin region has a high population density. • Almost 1/3 of Ireland’s population live in the Dublin region. • There are a number of reasons for this. • Dublin is where the government of Ireland sits. • It is Ireland’s main port. • It is Ireland’s main transport focus. (Air, Sea, Rail, Roads). • It is Ireland’s most important educational, cultural, and commercial centre. Dublin is therefore a zone of attraction for migrants, and foreign direct investment.
Population Density in Dublin: Change over time. • Up until the 1960’s, most people in the Dublin region lived in the city. • However, since then many people have moved out of the city to live in the suburbs. • The suburbs developed around villages in West Dublin like Tallaght, Lucan, Blanchardstown, and Clondalkin. • They also developed along the coast of North Co. Dublin.
Population Density in Dublin: Change over time. • Much of the growth in Dublin’s population has occurred in west Dublin. • Using evidence from the map, suggest 3 reasons for this. • _____________________ • _____________________ • _____________________
Population Density in Brazil • Brazil is a large country and its population is still increasing quickly. • However, the population is unevenly distributed. • Most people live along the coast. The population density is high. • Fewer people live inland. The population density is low.
Population Density in Sweden • Like Brazil, Sweden’s population is unevenly distributed. • Most of the people live in the south of Sweden. • Fewer people live in the north of Sweden. Why do you think this is?
Population Density in Sweden • The climate is warmer in the south. • There is better farmland in the south. • There are many mineral resources which are used to make steel products in the cities of the south. • There are good ports in the south which are important transport links to European markets.
Low Population Density • Areas of low population density have few people living in them. • In Ireland they are usually isolated rural areas or islands. • Outward migration from these areas is leading to a decrease in the population. • Young people leave these areas when they go to university or for work. They go to the big cities like Dublin, Cork, and Galway. • This can lead to many problems such as; - Low marriage rates – few young people remain to start families. - Abandoning farmland – young people don’t want to work on the farm. - Economic isolation – Businesses won’t set up there because there are few workers or customers.
The pull of the Leinster Region • What has happened to the population of Leinster since 1926? • What has happened to the population of Connacht and Ulster since 1926? • Why do you think this is happening?
High Salaries in the Dublin Region • Using evidence from the graph above, explain why people are attracted to the Dublin region.
Low Population Density – West Clare • Using evidence from the graph explain one reason why the population of this West Clare parish is declining. • Suggest one reason why fewer children are being born in the parish today. • Suggest one thing the Irish government could do to try to reverse this situation.
Low Population Density - Mali • Mali is one of the world’s poorest countries. It has a low population density. • Mali has a lack of rainfall and so it suffers from drought. This causes animals to die and crops to fail. • Part of Mali is covered by the Sahara Desert, and the desert is getting bigger each year. This is called Desertification. • The small population is spread throughout this huge country. Therefore, in this poor country it is difficult to make schools and health centres, and adequate roads for the people.