
Satellite-Based Agricultural Monitoring: Assessing Water Consumption and Vegetation Dynamics
This study presents a satellite remote sensing approach to monitor agricultural water consumption and vegetation dynamics in the Klamath Basin. The Washington Agricultural Monitoring system utilizes normalized difference vegetation index (NDVI) and land surface temperature (LST) data to estimate evapotranspiration (ET) and irrigation needs. By integrating satellite observations, the system provides timely and objective information on crop water use, aiding in efficient water management amidst challenges like drought and climate change. The approach enhances decision-making for sustainable agricultural practices.

Satellite-Based Agricultural Monitoring: Assessing Water Consumption and Vegetation Dynamics
E N D
Presentation Transcript
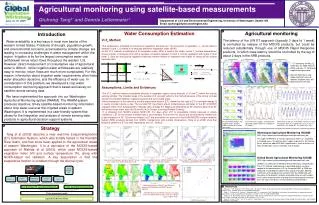
Agricultural monitoring using satellite-based measurements 1-fveg fveg Qiuhong Tang1* and Dennis Lettenmaier1 Developed by Qiuhong Tang 1Department of Civil and Environmental Engineering, University of Washington, Seattle WA *Email: qiuhong@hydro.washington.edu Bare soil Vegetation Upper Klamath Lake Ts (LST) NDVI / LST Klamath Basin Tsoilmax RS Window Tsoil Tsoilmin VI (NDVI) IL1 IL3 IL2 ET from UW ET product, VIC irrigation model, and VIC model estimates for Klamath Lake region. Time series of ET (upper), estimated and observed irrigation water consumption for IL2 (lower). Water levels at the lake. The model scenarios assume no irrigation (Non_IL); irrigation for IL1 (IL_1), for IL1 and IL2 (IL_12), and for IL1, IL2, and IL3 (IL_123). Measured instantaneous and daily mean EF at two fluxes tower sites (KL03 and KL03) in OR Daily net radiation from the MODIS/SRB estimates and fluxes tower observations Daily mean ET from fluxes tower observations, UW ET product and METRIC-based estimates. NOAA/ NESDIS SRB KL04 Irrigated Field KL03 Non-Irrigated Field ←Spatial distribution of daily ET and difference between MODIS/SRB and METRIC-based approach. Near Real Time ET, Agricultural Monitoring Other Agricultural Information Water management model →METRIC-based and UW ET estimates averaged over the irrigated (dark symbols) and non-irrigated (gray symbols) fields. Agricultural Decision Maker ❸ ❹ ❶ Water Consumption Estimation Agricultural monitoring Introduction Water availability is a key issue in most river basins of the western United States. Problems of drought, population growth, and environmental concerns, accentuated by climate change, are leading to increasing challenges in water management within the region. Irrigation is by far the largest consumptive water use (withdrawal minus return flow) throughout the western U.S. However, direct measurement of consumptive use of agricultural water is difficult - while irrigation water withdrawals are relatively easy to monitor, return flows are much more complicated. For this reason, information about irrigation water requirements often limits water allocation decisions, and the efficiency of water use. In consideration of this problem, we developed a crop water consumption monitoring approach that is based exclusively on satellite remote sensing data. We have implemented the approach into our Washington Agricultural Monitoring system (WAAM). The WAAM system produces objective, timely satellite-based monitoring information about crop water use over the irrigated areas of eastern Washington. It is implemented in a user-friendly system that allows for the integration and analysis of remote sensing data products in agricultural decision support systems. • VI-Ts Method • The landscape is simplified as a mixture of vegetation and bare soil. The proportion of vegetation, fveg whose value is between 0 and 1, is related to normalized difference vegetation index (NDVI). • In the VI-Ts method, a scatterplot of VI (vegetation index, NDVI is used in this study) versus Ts (surface temperature) shows a linear or triangular form with a negative correlation between VI and Ts. Dense vegetation with higher VI has lower Ts. Bare soil and sparse vegetation becomes warmer relative to vegetation with higher VI values as the surface becomes drier. The latency of the UW ET approach (typically 3 days to 1 week) is controlled by release of the MODIS products, but could be reduced substantially through use of MODIS Rapid Response products, in which case latency would be controlled by the lag of about 2 days in the SRB products. ← ET monitoring for May 22, 2008, May 25, 2008, May 30, 2008, and June 17, 2008 over cropland and grassland. Klamath River basin and Upper Klamath Lake are labeled. Irrigation areas are downstream of the lake. • Assumptions, Limits and Evidences • The VI-Ts method requires substantial diversity in vegetation types (hence diversity of VI and Ts) within the remote sensing window. The irrigated areas of the western U.S. are well suited to the method because of the strong contrast across the interface between irrigated cropland and surrounding areas. • A key assumption of the method is that the evaporative fraction (EF), defined as the ratio of ET to available energy Q, is nearly constant during a day. The constant EF hypothesis allows instantaneous estimates of the EF at MODIS overpass times to be extrapolated to estimate daily average ET. Measured instantaneous EF matches daily mean EF well at two fluxes tower sites (KL03 and KL04) in Oregon (courtesy Richard Cuenca). • Ts is obtained from MODIS product MOD11A1. For days when LST is unavailable (mostly because of cloudy conditions), LST for the closest available day is used instead. Errors from this source are constrained by modest day to day variations of EF. Cloud cover effects on ET are also taken into account in the NOAA/NESDIS surface radiation budget (SRB) products derived from GOES. Comparisons with surface observations (Tang et al, 2009) show that temporal patterns of ET are well captured by the VI-Tsmethod. ❷ Strategy Washington Agricultural Monitoring (WAAM) URL: http://www.hydro.washington.edu/forecast/rset_wa/ The target of WAAM is to monitor agricultural water use, especially in irrigated areas. The primary focus region at present is the Yakima Basin, which has about 500,000 irrigated acres, much of which is in high valued crops such as orchards and vineyards. Tang et al (2009) describe a near real-time Evapotranspiration (ET) Estimation System, which was initially tested in the Klamath River basin, and has since been applied to the agricultural areas of eastern Washington. It is a derivative of the MODIS-based approach of Nishida et al (2003), which uses MODIS-based vegetation index (VI) and surface temperature (Ts), along with GOES-based net radiation. A key assumption is that the evaporative fraction is constant through the diurnal cycle. United States Agricultural Monitoring (USAM) URL: http://www.hydro.washington.edu/forecast/rset_usa/ USAM is an extension of WAAM to the conterminous United States. The VI-Ts method, implemented as described above, has been applied to the conterminous U.S. for the period 2001 to 2008 was produced at 0.05 degree (about 5 km) spatial resolution. Monthly summaries of the product are available from the USAM web site. Accuracy of the product has been evaluated using a small number of flux tower measurements and long-term water balance estimates over the major river basins of the continental United States. MODIS/ GOES ❺ References Nishida, K., R. R. Nemani, S. W. Running, and J. M. Glassy (2003), An operational remote sensing algorithm of land surface evaporation, J. Geophys. Res., 108(D9), 4270, doi:10.1029/2002JD002062. Tang, Q., S. Peterson, R. Cuenca, Y. Hagimoto and D. P. Lettenmaier, 2009. Satellite-based near-real-time estimation of irrigated crop water consumption. Journal of Geophysical Research, 114, D05114, doi: 10.1029/2008JD010854. Tang, Q. E. A. Rosenberg, and D. P. Lettenmaier, 2009. Use of satellite data to assess the impacts of irrigation withdrawals on Upper Klamath Lake, Oregon. Hydrology and Earth System Sciences, 13, 617-627. Tang, Q. H. Gao, P. Yeh, T. Oki, F. Su, and D. P. Lettenmaier, 2009. Dynamics of terrestrial water storage change from observations and modeling J. Hydromet., (submitted).


